
Contents
- Map Warper Tool
- Lesson Goals
- Getting Started
- Georeferencing your map with Map Warper
- Visualization
- Final considerations
Map Warper Tool
Developed by Tim Waters, Map Warper is an open-source georeferencing service, written in Ruby on Rails; the application lets users upload scanned maps and georeference them against OpenStreetMap. It allows the georeferencing and visualization of geographic areas without the need to install software. The tool is implemented in various digital projects across the world and used by many professionals who are not necessarily experts in the field of cartography.
Map Warper was designed to georeference historical maps (world maps, portolan charts, nautical charts, topographic charts, architectural blueprints, geographical charts), aerial photographs, and other cartographic materials contained in cultural heritage collections. In this sense, the tool allows the user to generate georeferenced materials for working on desktop rasters or online (Map Server) in order to link to geographic information systems (QGIS, JOSM, ArcGIS, Google Earth, WorldMap, and others). The tool’s collaborative settings also help to decentralize and streamline georeferencing processes, cataloging and visualization.
Thanks to these characteristics, the tool is useful for researchers, professors, and students, as well as for institutions that are developing digitization, visualization, and cartographic experimentation processes for their collections or for the development of spatial humanities, such as the New York Public Library, Library of Congress, David Rumsey Map Collection, and the British Library.1
Lesson Goals
Global trends have been profoundly marked by technological development and a marked epistemological shift that focuses on spatiality, which, in turn, has influenced the fields of social sciences and humanities. Technology has expanded research and visualization possibilities, thereby changing the ways we can think about and interpret the past. As a result, Map Warper is both product and producer of these technological relationships that generate and expand new interpretations.
Georeferencing is the process of assigning geographic coordinates to a scanned map or raster image. Many historians georeference maps to study how places have changed over time. In this lesson, we will take you through the steps to align geographic coordinates to a scanned historical map and show you how to export your georeferenced map.
This lesson was conceived as the first component of a larger module oriented toward the usage of digital tools for georeferencing, vectorization, extraction, organization, and experimentation with geographic data in archival bibliography and cartography digitized by different institutes (archives, libraries, museums).
In this tutorial you will georeference an 1860 map of North Carolina and South Carolina from the David Rumsey Map Collection.2 There is an export button above the map. Click the export button to download the image of the map. The file will download as a .zip file, which includes a .jpg file of the map and a metadata .txt file. When clicking on the export button, we recommend downloading one of the largest files to ensure you have the highest resolution of the map. Once you have uncompressed the .zip file, save the .jpg to your computer as NC_SC.jpg.
Before you begin georeferencing a scanned map, it is important to understand the locations depicted on the map, as well as the historic context of the map’s creation. Not all historic maps are good candidates for georeferencing. The map must include enough information to allow the user to confidently assign latitude and longitude coordinates or align it with a Geographic Information Systems (GIS) map using physical features. Often, you will need to research the location of historic places and features that no longer exist, and make an informed decision to identify their proper placement. Some maps may not have enough geographic information, and may become so warped when georeferenced that they become illegible or inaccurate.
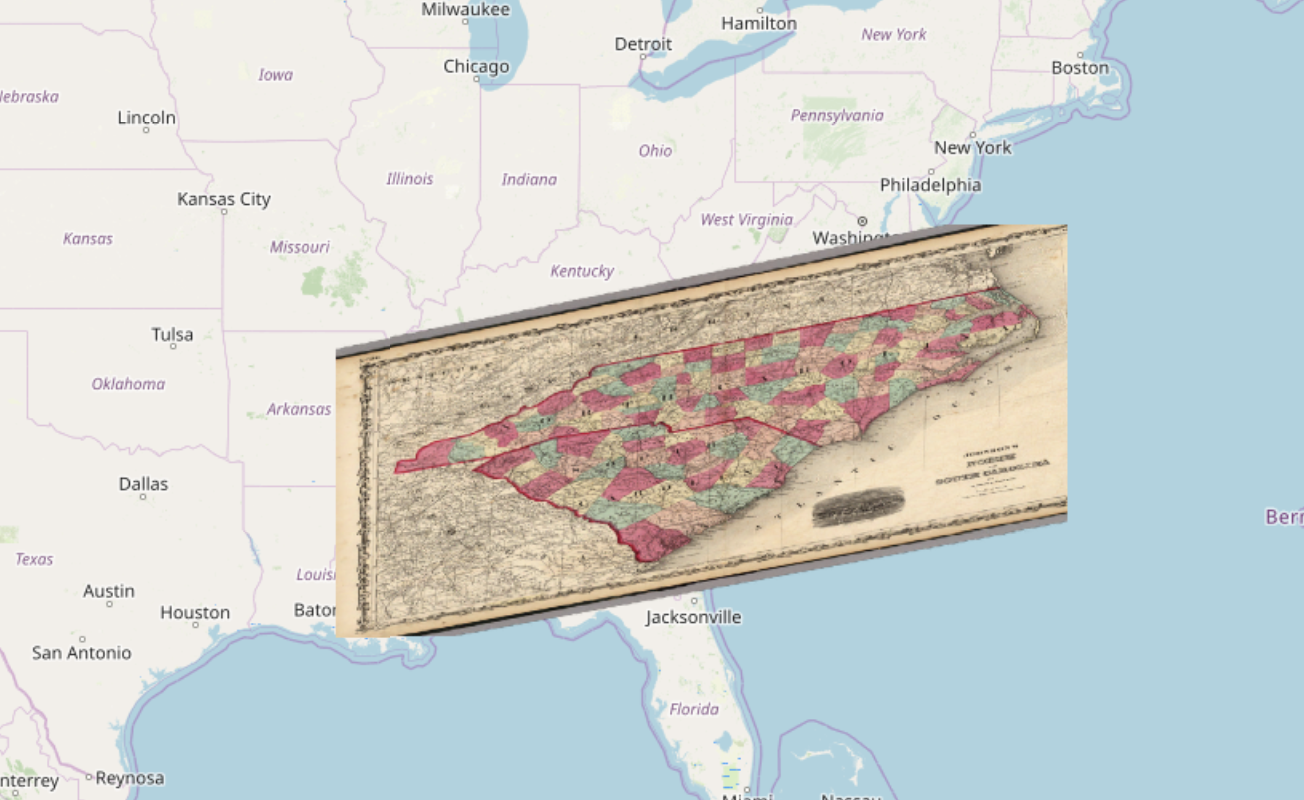
Figure 1: A map too warped to be used effectively.
The scale, resolution, and projection of a scanned map are also important considerations when choosing a historic map to georeference. Small scale maps are generally not well-suited for highly detailed georeferencing and may cause problems with representing exact feature locations. When selecting or scanning a historic map for georeferencing, it is best to use a map that has been scanned at a high resolution (300 dpi or greater), so that you can easily see the features on the map when zooming in and out. It is also best practice to use the same projection as the historic map in order to minimize distortion. Georeferencing a map in the wrong projection can create a mismatch between the historical and current maps, stretching the lines, shapes, and the distance between objects. Map Warper does not provide an option to re-project your map data; if you are unable to achieve a legible map, or if you are measuring distance, you may need to use a more advanced GIS software, such as QGIS which will allow you to specify the map projections. For more details on best practices for georeferencing, see Esri’s list of recommendations.
Some guiding questions to ask are:
- What location is represented in the historical map/cartographic image?
- What were some of the changes that have taken place since it was created?
- Do you recognize any current geographical reference points?
- What is the correct orientation of the image?
In this tutorial, you will work with Map Warper to create a georeferenced historical map, then overlay it on a modern base map in order to publish and interact with it on the web.
This tutorial complements other Programming Historian lessons that reference the use of GIS for spatial analysis: Georeferencing in QGIS 2.0 and Intro to Google Maps and Google Earth. In addition to learning the necessary technical steps for georeferencing historical maps, this lesson will serve as an introduction to the study of cultural heritage cartography and their potential in historical research.
Getting Started
Create an Account
Using your favorite browser, navigate to https://mapwarper.net and click on the “Create Account” tab in the upper right hand corner of the window. You can choose to log in using your Facebook, OpenstreetMap or GitHub account to facilitate the registration process.
Figure 2. Create Account.
Upload Map
On the Home page, click the green button labeled “Upload Map” to import your scanned map to Map Warper directly from your local file or linked from an online repository via a corresponding URL. During this step you can also start adding metadata to the material you will georeference.
Toward the bottom of the screen, click on the Choose File button under “Upload an image file.” Navigate to the NC_SC.jpg map that you downloaded to your computer and click Create.
Edit
The next screen asks for descriptive information that will make the map easier to find (also known as metadata). The metadata field is also accessible via the Metadata tab. While only the Title field is required, it is generally best practice to provide as much information as possible, so other users can learn more about the source of your scanned map you are georeferencing. Fill in the metadata based on the information provided to you about the historical map that you’re working with. For the North Carolina and South Carolina map, you can find the map’s metadata beside the map on the David Rumsey Map Collection’s website. Due to the collaborative and collective nature of Map Warper, we recommend that you include the following metadata:
- Title: Title and registration number. This organizes the information to make it easier to find the map in its original repository.
- Description: Reference for the cartographic image.
- Issue Year: Year in which the map was created or published.
- Tags: 3-5 keywords that describe the map.
- Subject Area: Typology for the cartographic material.
- Source: URL for the document source.
- Place of publication: Location where the document was published or created.
- Scale: Numerical scale.
- Metadata Projection: Cartographic projection.
Georeferencing your map with Map Warper
You will start by uploading a map and georeferencing it using Map Warper. Map Warper has a variety of export options, including WMS URL, Tiles, GeoTIFF or KML file. If you would like to display your georeferenced map online, see the Programming Historian tutorial Displaying a Georeferenced Map in Story Map JS.
Map Visualization
This tab will display a visualization of the attached georeferenced map or cartographic document. The navigation tools provided include the option to zoom in and move around the map.
Users may find it helpful to identify the types of points to georeference (urban and natural locations, jurisdictions, roads, etc.) as well as the different resources that can be used to cross-reference and to supplement the information provided (statistics, governmental reports, personal documents, or even cartographic images created before or after the one used for this visualization). These considerations can be very useful for research development, since the digital visualization should help to facilitate the critical interpretation of the material. This is especially evident in the use of maps that contain cultural heritage information (for example, trade routes, shifting borders, natural resources, etc.).
The interface is organized into the following tabs:
- Show: displays only your map image
- Edit: allows you to edit the descriptive text (metadata)
- Rectify: used for the georeferencing itself
- Align: a useful tool if you are stitching together multiple maps
- Preview: shows your map overlaid on a modern base map
-
Export: gives you a variety of export options and formats
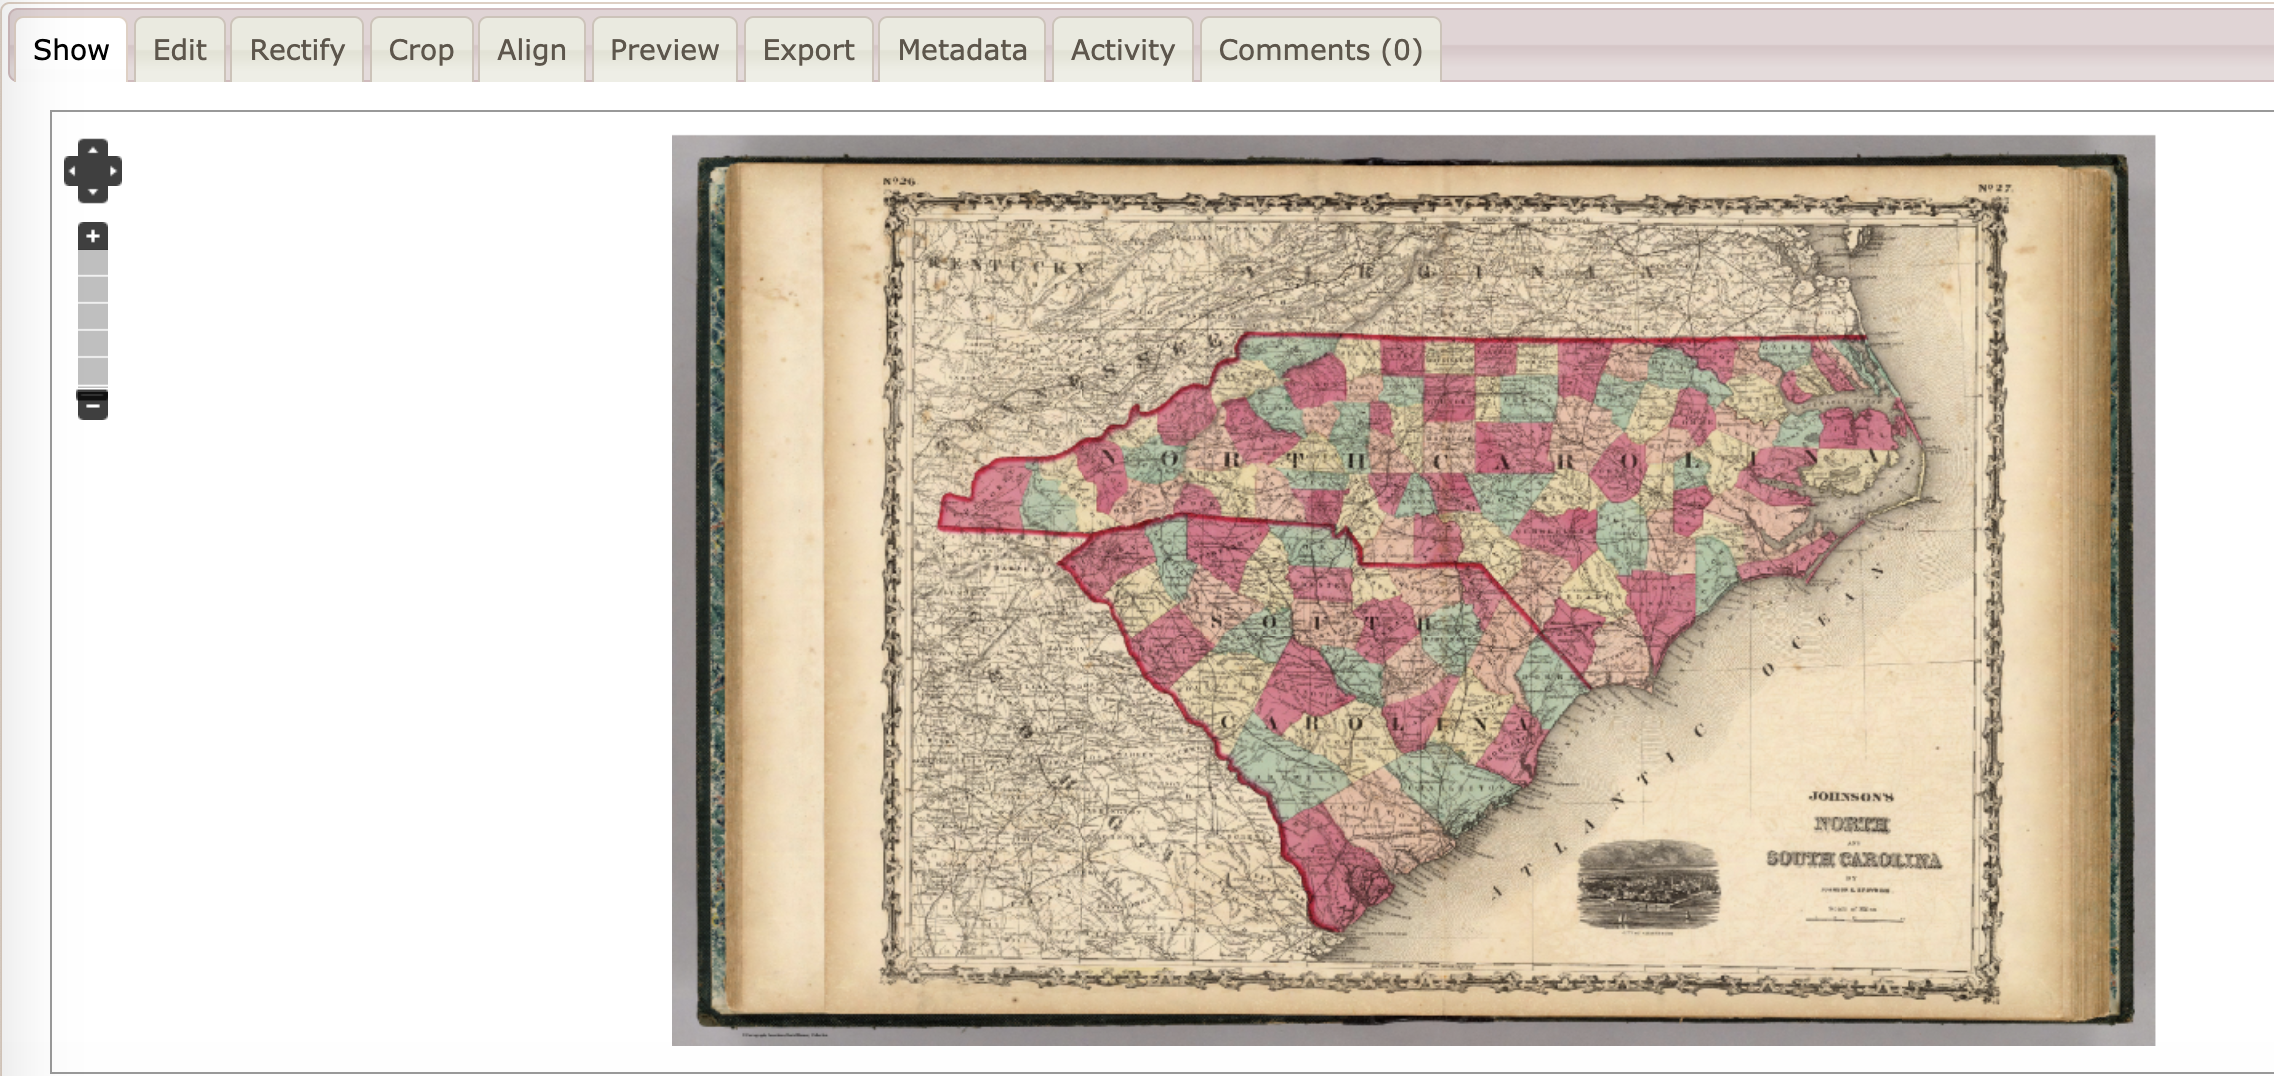
Figure 3. Map Warper interface.
Georeference your map
In this section, you will georeference the uploaded map. Click on the “Rectify” tab; here you will find two windows: on the left is the uploaded map; on the right is the OpenStreetMap base map (this is the layer that provides the reference points for your uploaded map image). Below these windows, you will find the “Control Panel,” which allows you to fine-tune your control points, and check their level of accuracy.
 Layer allows you to select a base layer from either OpenStreetMap or Mapbox Satellite. It also includes the Overlay function that allows you to superimpose your working map image (the North Carolina and South Carolina example or your own image) after confirming the georeference.
 Add Custom Basemap in the right box allows you to add another custom base layer in XYZ Tiles format (such as OpenStreetMap, Google Maps, Bing, CARTO, ESRI, Stamen, and other layers).
You can also add the following georeferenced basemaps from Map Warper:
* Google Maps: https://mt1.google.com/vt/lyrs=r&x={x}&y={y}&z={z}
* Google Satellite: https://www.google.cn/maps/vt?lyrs=s@189&gl=cn&x={x}&y={y}&z={z}
* Bing Satellite: https://ecn.t3.tiles.virtualearth.net/tiles/a{q}.jpeg?g=0&dir=dir_n’
* CARTO dark: https://a.basemaps.cartocdn.com/dark_all/{z}/{x}/{y}.png
* Stamen Watercolor: https://tile.stamen.com/watercolor/{z}/{x}/{y}.jpg
 Add control point, available in both boxes, allows you to add control points that associate points on the uploaded or selected map to the predetermined base layer.
 Move Control Point permits you to move or relocate the control points and add them to both windows.
 Move Around Map lets you explore the maps in both windows without having to assign or move any control points. This is helpful for verifying the assigned control points.
The lock between the two windows helps guide the assignment and movement of the control points.  The Zoom lock option allows you to zoom in on the maps in both windows simultaneously. This is useful to place and verify the control points. Clicking on the lock again will unlock it.
  The Pan function allows you to pan to different sections of the images, separately.
 The Keyboard shortcuts button provides quick access to the following:
- p: Keyboard activates Add Control Point
- d: Keyboard activates Move Control Point
- m: Keyboard activates Move Around Map
- q: Keyboard adds a control point in your cursor location.
- a: Keyboard adds a control point in your cursor location in both windows.
- Enter: Keyboard replaces the Add Control Point mouse click to confirm the position of the pin.
Clicking on Control Points in the Control Panel displays a table with the location values (X, Y coordinates and latitude, longitude) for the control points that you have assigned. You can delete points here or edit latitude and longitude.
This table also includes a section that defines the geometric error value, caused by the georeferencing of the historic map document. This calculates the error value of each point according to a weighted average, and classifies the error in blue (low error), yellow (some error), or red (significant error). See the note about the way the Root Mean Square error is calculated, below.
Download the points as a CSV file (comma separated values) by selecting the option under Ground Control Points. This file is useful for importing data into other applications. This file can also be a form of digital preservation for processing the archival map’s georeferenced data.
By clicking on Add Control Point Manually you can add a control point with X, Y coordinates and on the original image to the base map layer with longitude and latitude. If you know the geographic coordinates, this can facilitate aligning control points on the base layer with higher accuracy.
Add Control Points from CSV allows you to upload a .csv file to automate the georeferencing process. The first row must contain the Control Points table headers. The proceeding rows should contain data for the X, Y coordinates for the image (X,Y) and the destination (Lon,Lat), separated by commas.
The following .csv example contains four columns, labeled ‘x’, ‘y’, ‘lon’ and ‘lat’ in four rows, including the headings. This is the same file as the one downloaded using the  CSV icon button.
x,y,lon,lat
3765.7477558347,1290.9407540395,-81.6339111296,36.5890683701
6424.7889362654,3307.9939407561,-77.8738403289,34.2299708101
7824.94456912,1323.6674147237,-75.9979248017,36.5184659884
Practice
1. Click on the Rectify tab.
2. Take a moment to move the map on the right to the North Carolina and South Carolina region. The arrows at the top of the screen move the map slightly to the north, south, east, and west, and are useful when you need to make small adjustments to the map. You can zoom in and out with the slider or with your trackpad/mouse. To move around a map, click the hand icon.
3. Once you feel comfortable moving around the maps, select your first control point. Start from the historic map and choose a location —for example, a city— that will be relatively easy to find.
4. Then, click the green control point marker on the modern map and find the same location to match them up.
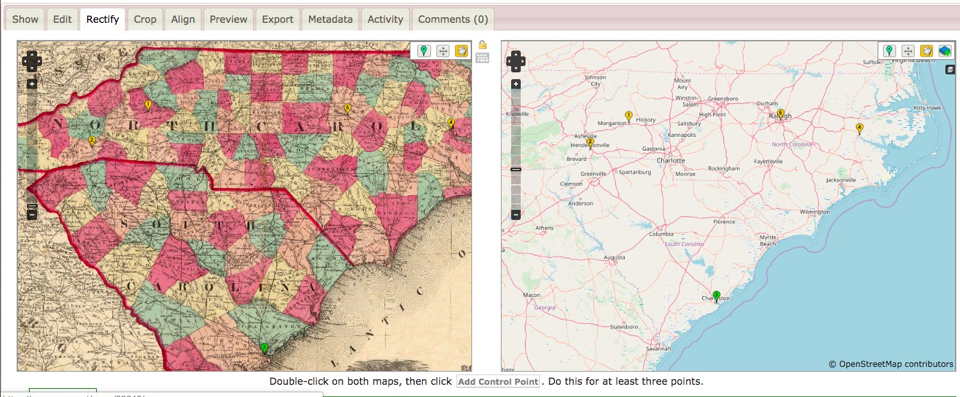
Figure 4. Match up your control points.
5. If you do not click the Add Control Point button, the next time you click on a map, the control point you’ve added will move. This functionality gives you the flexibility to adjust your points while adding them, but can be confusing if you don’t realize that your point has moved because you didn’t click Add Control Point.
6. Add at least 4 or 5 points. Spreading the points out across your historic map and focusing on state borders, rivers, county lines, and major cities is a good strategy. If you need to delete a control point, click on “Control Points” in the Control Panel below the map.
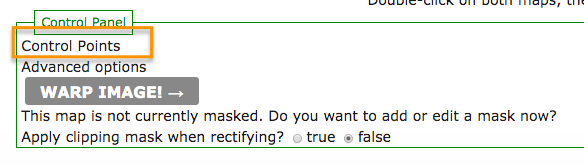
Figure 5. Select Control Points in the Control panel.
7. Selecting Control Points will display all of the points you have added, and allow you to delete any points that you want to re-do. You can also change latitude and longitude points manually.
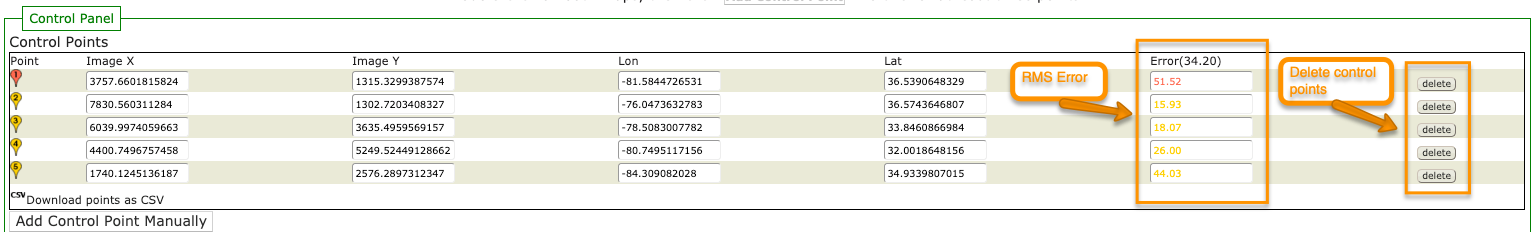
Figure 6. Deleting control points and the RMS error.
8. When you have enough points and think they are well-distributed across your historic map, click Warp Image! at the bottom of the page. Georeferencing maps takes practice. You may find that your rectified map creates an unreadable, warped map. We encourage you to try steps 7-9 again, taking into account best practices for georeferencing mentioned above, such as identifying major cities, roads, streams, and rivers that you can identify with confidence.
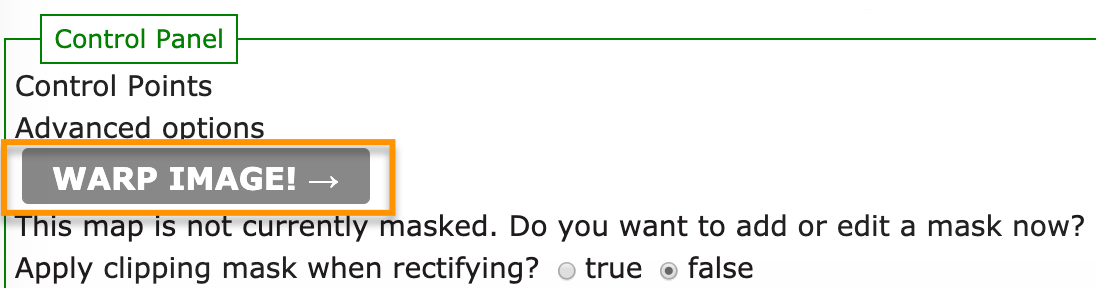
Figure 7. Click Warp Image! to rectify your map.
9. You will now see the map layered on top of the OpenStreetMap.
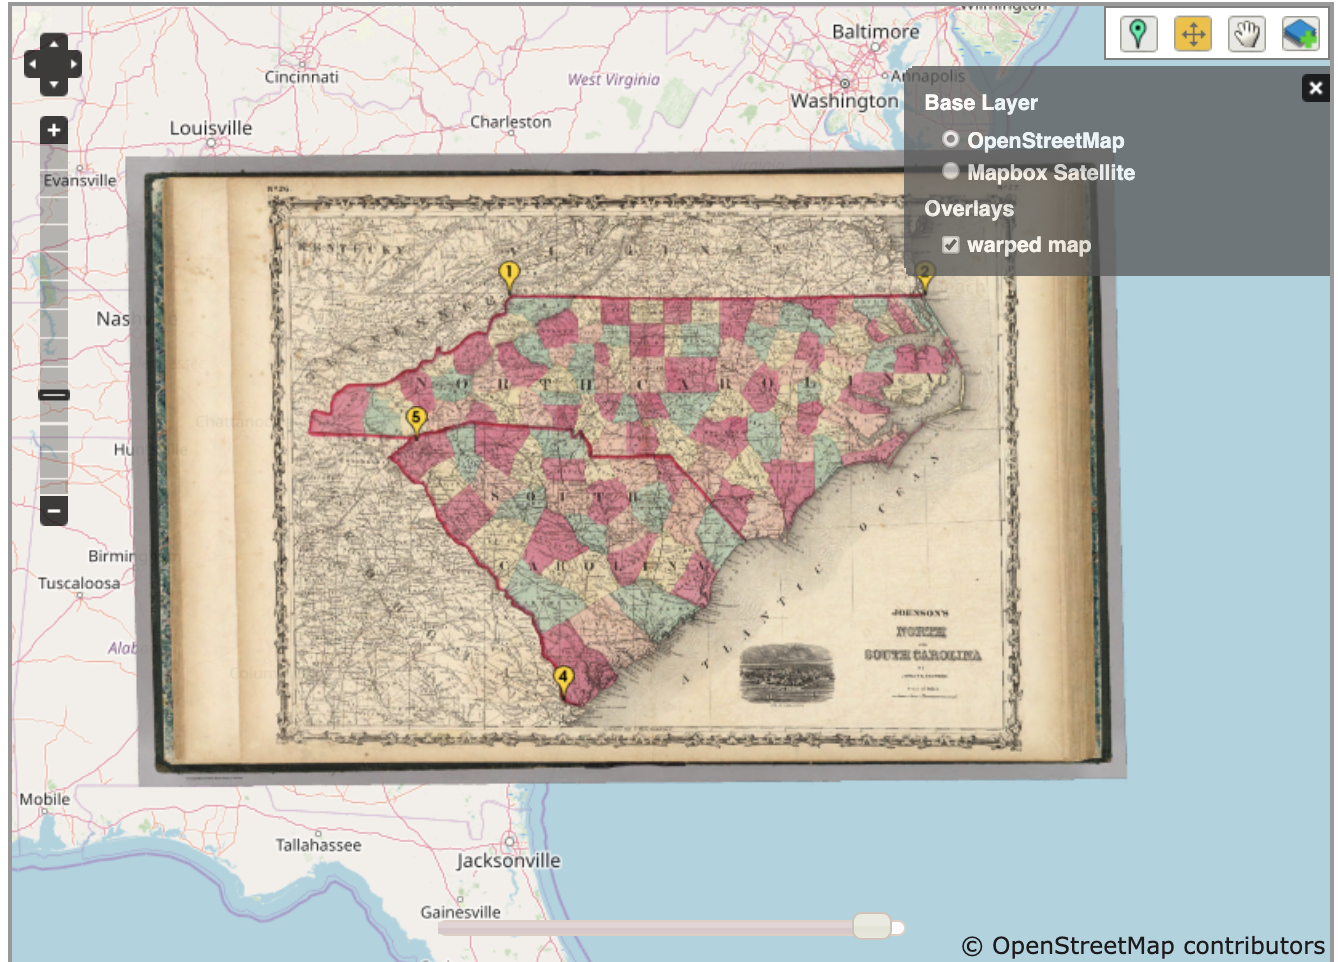
Figure 8. Georeferenced map in OpenStreetMap.
10. You can choose to view a satellite image base map or the regular OpenStreetMap layer we’ve been using.
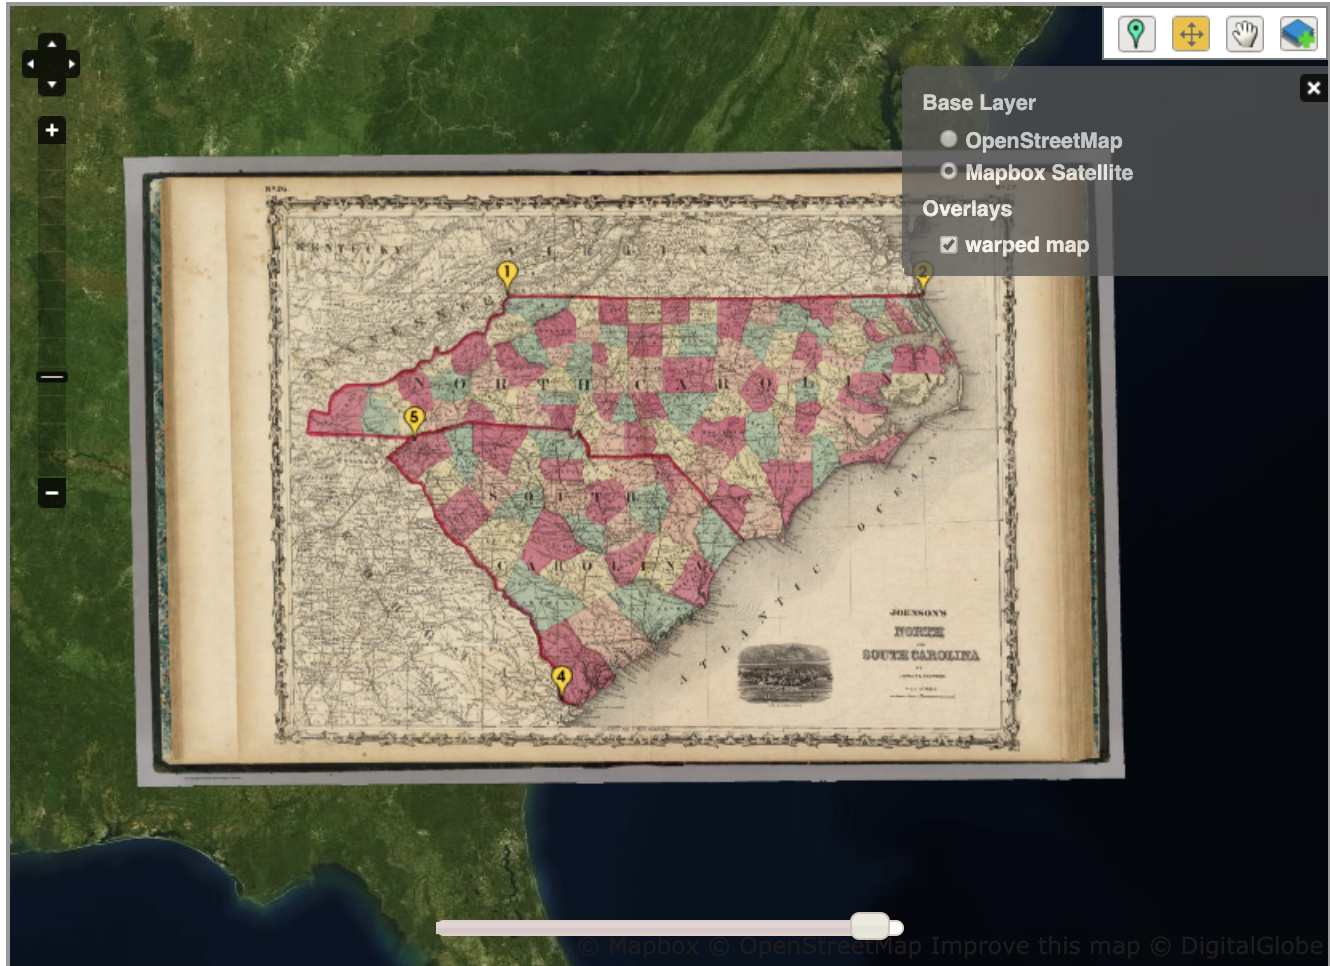
Figure 9. Georeferenced map in satellite view.
11. Click the Preview tab for a larger view of the georeferenced map. Changing the transparency using the slider can give you a sense of how accurate your georeferencing has been applied.
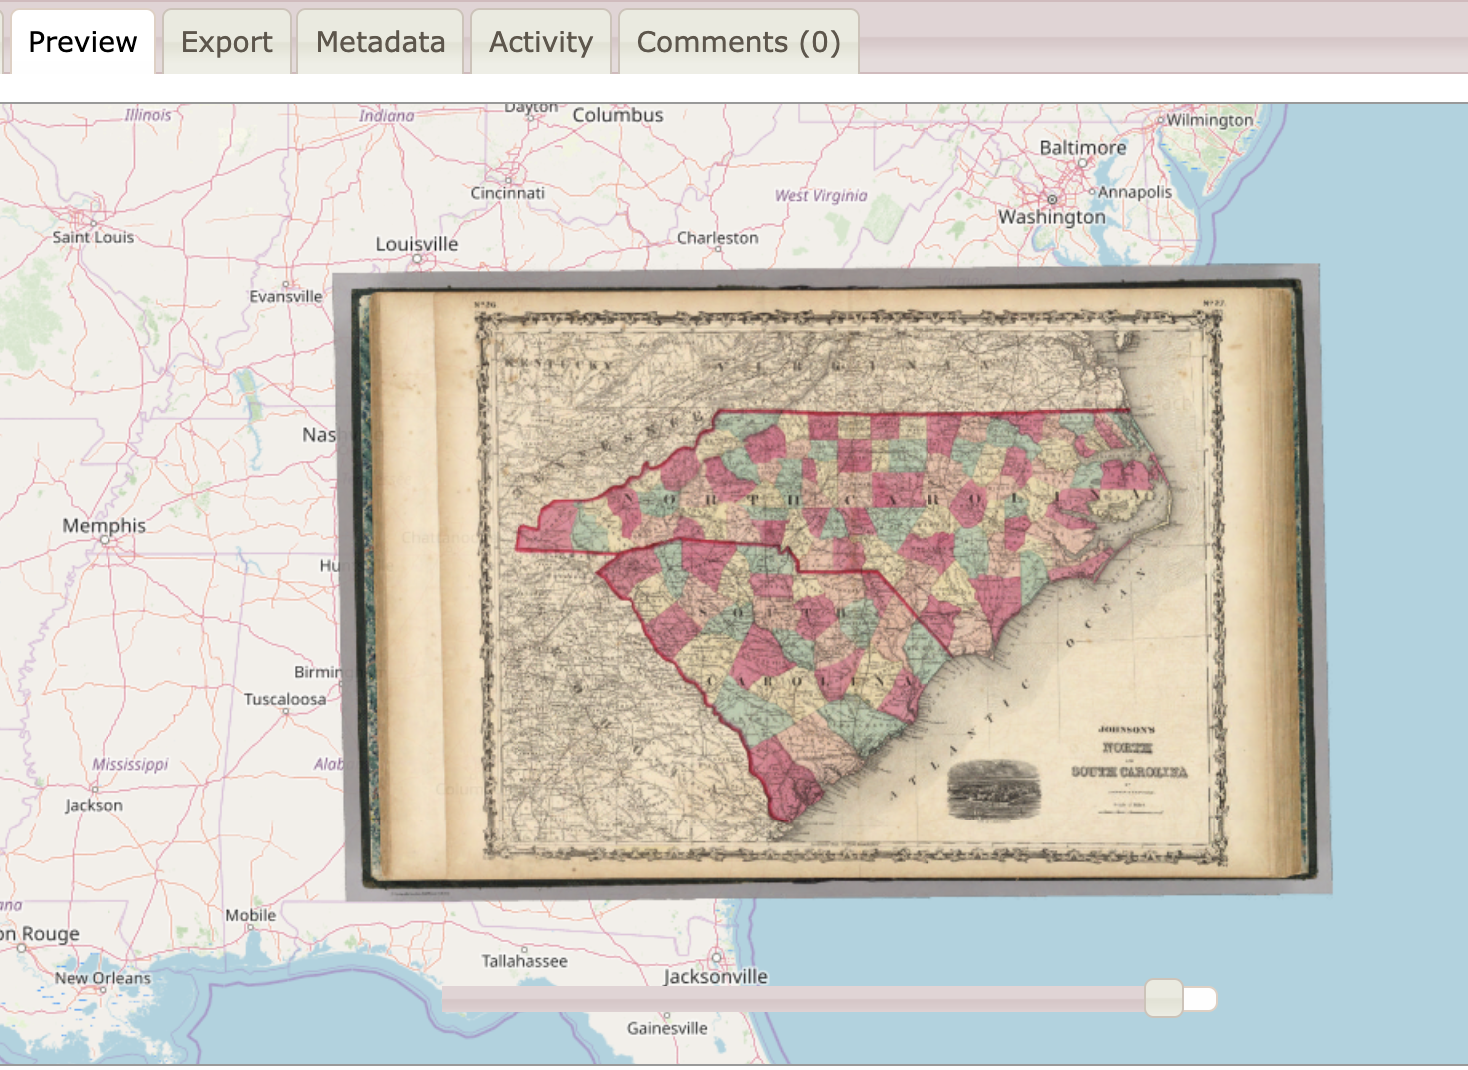
Figure 10. Map Warper Preview.
Cropping
The Crop tab allows you to crop a section of the uploaded map. This is useful for dividing maps into composites. The display window integrates the following actions:
- : Move around Map
 : Draw new polygon to mask
 : Delete a polygon
Draw around the area you wish you keep. Then to apply the mask to the map, click “Mask Map!”
Align
The Align tab allows you to organize several maps into a mosaic. This tool is good for connecting fragmented maps, aerial photographs, and other fragmented cartographic documents. Click “align map” to align the images.
Preview
This tab allows you to visualize the results of your work in the Rectify step. This is useful to continue the georeferencing step. The display window also integrates the same tools: move, zoom, transparency, and layer .
Visualization
Export your map
The Export tab allows you to export the georeferenced map in different standard formats for GIS visualization platforms. The exportable formats are grouped into three categories:
- Images: GeoTiff, rectified PNG. These formats aggregate geographic coordinates and a projection system onto the cartographic document, allowing the georeferenced document to be linked to a GIS application. This format is recommended for working on computers without a stable Internet connection or no connection.
- Map Services: KML, WMS, Tiles. These geographic formats are similar to those of Images, but they can only be used on computers with an Internet connection.
- Ground Control Points: CSV. This category allows the downloading of the Control Points table created in the “Rectify” step. The table groups the control points between the raster image (historic map document) with the OpenStreetMap vectoral map. That is, it associates the X, Y coordinates with longitude, latitude, respectively.
The georeferenced image can have different functions/behaviours due to the projection, the coordinate system, the ellipsoid, and the datum used by the corresponding GIS platform.
You are now ready to export your map. Click the Export tab. Under the Map Services, copy and paste the Tiles URL and save this link to be used later in the Displaying a Georeferenced Maps in Story Map JS Programming Historian lesson. Here is an example of how the URL is formatted:
https://mapwarper.net/maps/tile/40217/{z}/{x}/{y}.png
Activity
The Activity tab maintains a summary of changes made to the map. The activity log includes the following fields: Time, User, Map, Activity summary, Version, and Further details. Any Map Warper user can monitor the changes to the map. Additionally, the  “RSS Feed” allows the user to download general information about all changes in .rss format.
Comments
The Comments tab allows users to aggregate comments about the map. This is an open channel that allows others to communicate with the user who shared the cartographic material. It is also a useful place to enrich the description and cataloging of the uploaded map. Make sure to click add comment to save.
Final considerations
The technical steps learned in this lesson are useful not only for georeferencing historical maps, but also for reflecting on the distinct spatial relations between place, history, and subjects. It is also useful for connecting the digital map to data from other primary sources (official documents, statistics, photographs, testimonies, etc.). In this sense, the lesson is an introduction to the possibilities of the use of this type of material, the historical perspectives of the social dimensions that are represented in the georeferenced object, and that will continue to stimulate the field of spatial humanities.
Endnotes
-
Spanish-language resources include Biblioteca Nacional de Colombia’s Mapoteca Digital, Cartografía de Bogotá de la Universidad Nacional de Colombia, and Paisajes coloniales: redibujando los territorios andinos en el siglo XVII de la Universidad de los Andes (Colombia). ↩
-
The original Spanish tutorial uses a 1933 coffee map of the Republic of Colombia from Mapoteca Digital de la Biblioteca Nacional de Colombia, published by the Federación Nacional de Cafeteros de Colombia (National Federation Colombian Coffee Growers). This lesson substitutes the map in order to provide English-speaking users with a map with geographical locations in English. ↩