
Contents
- Lesson Goals
- Creating your narrative with StoryMap JS
- Step 1: Exporting a tile URL for your georeferenced map
- Step 2: Accessing StoryMap JS
- Step 3: Adding your georeferenced map to StoryMap JS
- Step 4: Add additional slides
- Step 5: Adding content and media items for each location (slide) in StoryMap JS
- Step 6: Customize your Story Map
- Conclusion
- Endnotes
Lesson Goals
Georeferencing is the process of assigning geographic coordinates to a scanned map or raster image. Many historians are now georeferencing historical maps to study how places have changed over time. After georeferencing a historic map, you may want to display it online to share your research or tell a story. In this lesson, we will show you how to share a georeferenced map online using StoryMap JS, an interactive web-based mapping platform. StoryMap JS is an open-source tool from Knight Lab at Northwestern University, which allows you to integrate historical and contemporary maps into interactive stories. If you haven’t yet created a georeferenced map, the Programming Historian lessons on Georeferencing in QGIS 2.0 and Introduction to Map Warper offer detailed tutorials.
Creating your narrative with StoryMap JS
Before you get started with building your map, you should think about how you would like to structure and organize content to effectively communicate your narrative. The StoryMap JS interface allows you to connect text and media items (images, video, or audio) to locations on your map in a linear sequence. Each location on a map has an associated slide with an optional media item, header, caption, and descriptive text. It is highly recommended you use a spreadsheet or a document to gather the following information before building your map:
- the location of each slide
- a headline or title for each slide
- text/content for the content box for each slide
- media (images, URLs for video/audio) including, credits and captions for each slide
To get started with accessing Story Map JS, you will need a Google account to access the StoryMap JS online authoring tool. If you don’t have a Google account and would prefer to host your own version of StoryMap JS on a web server, see Knight Lab’s technical instructions and their GitHub repository to view their open-source code. For this lesson, we will be using the StoryMap JS authoring tool through Google.
Step 1: Exporting a tile URL for your georeferenced map
To complete this tutorial as written, you will need to export a georeferenced map from Map Warper. Map Warper offers several map services for exporting your georeferenced map, including KML (for use in Google Earth, etc.), Web Map Services (WMS) URL, and Tiles (Google/OSM scheme).
The Map Warper export URL you will need for this tutorial is the Tiles (Google/OSM scheme) option. This is the URL you will use to add your history basemap to the StoryMap JS for the lesson; this URL is for a map of North and South Carolina that has already been georectified and exported from Map Warper. To learn more about exporting a georeferenced map from Map Warper, see our translation of Anthony Picón Rodríguez and Miguel Cuadros’s lesson Introduction to Map Warper. Please note that you won’t be able to visit the URL in a web browser, but you will be able to load it into StoryMap JS. The URL will be formatted as:
https://mapwarper.net/maps/tile/40217/{z}/{x}/{y}.png
This URL generates a set of map tiles of your georeferenced map to be displayed online. Map tiles are essentially little square images which are assembled into an interactive map. They work by requesting a set of tiles of the desired latitude (Y), longitude (X), and zoom level (Z) to bring together a tileset to form a larger image of your map. Map tiles are commonly used to serve up imagery or pre-rendered cartographic datasets inside a web mapping environment and are often used as an alternative for using vector data, when the amount of data becomes too dense.
The Tiles (Google/OSM scheme) URL can be found under Map Services in the Export tab of the georeferenced map you have selected in Map Warper. Keep a copy of this URL to be copied and pasted into StoryMap JS.
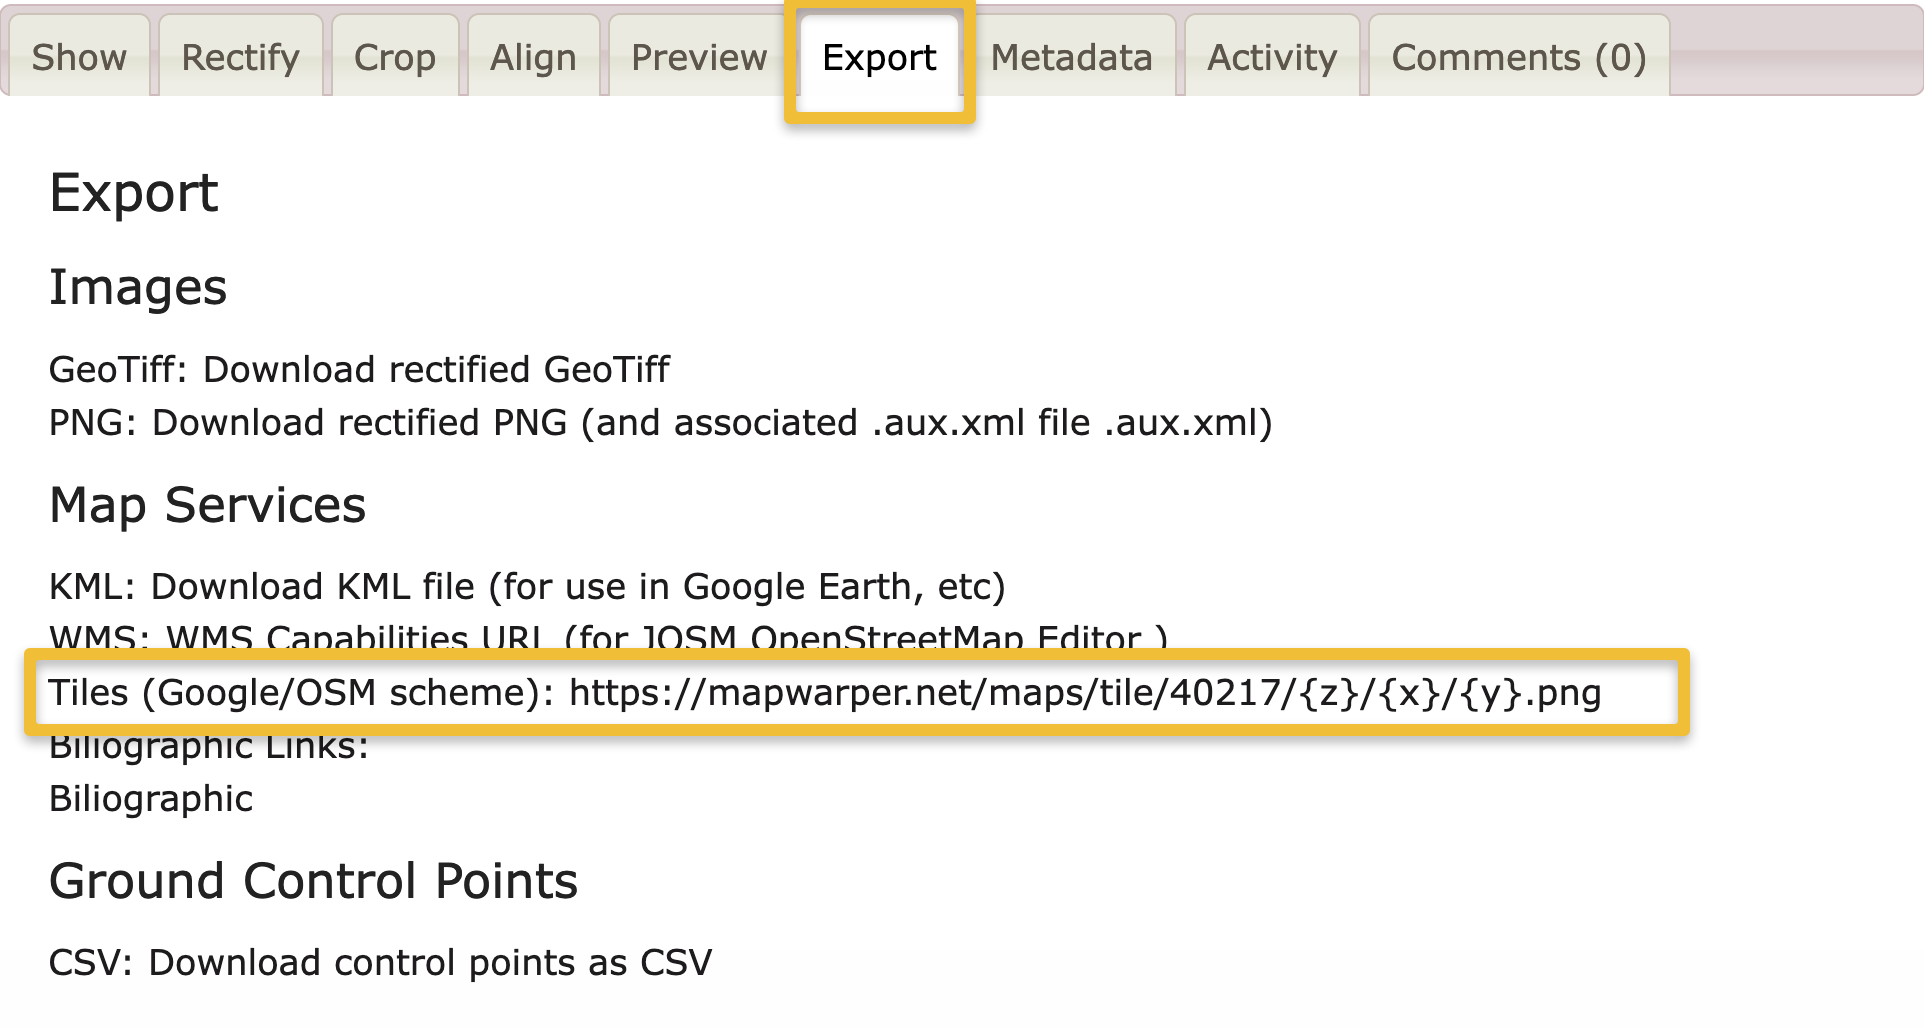
The Tiles (Google/OSM scheme) URL of your georeferenced map can be found under Map Services in Map Warper’s Export tab.
Step 2: Accessing StoryMap JS
To access the StoryMap JS authoring tool, go to the StoryMap JS website and click on the green button that says “Make a StoryMap””
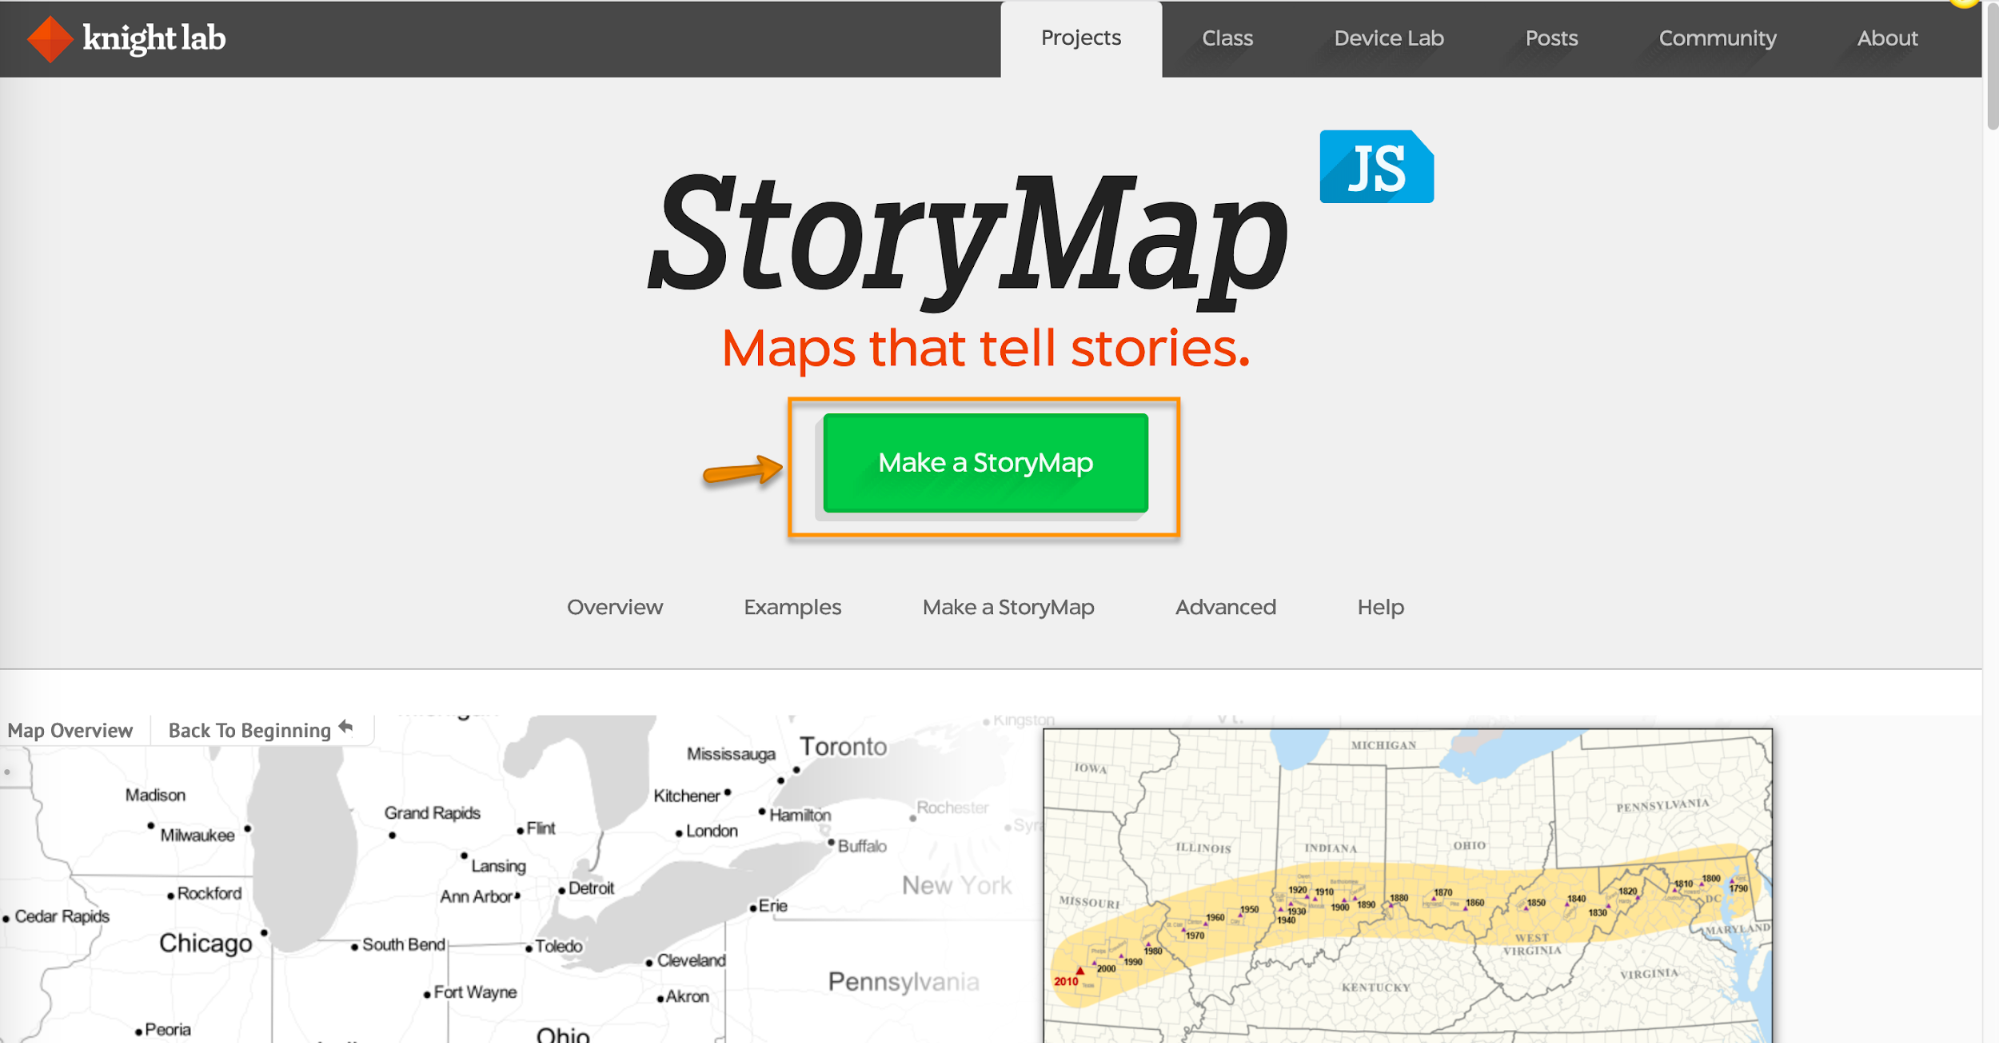
Story Map JS: Make a StoryMap.
You will be prompted to login with a Google account. If you don’t have one, you can create one at gmail.com.
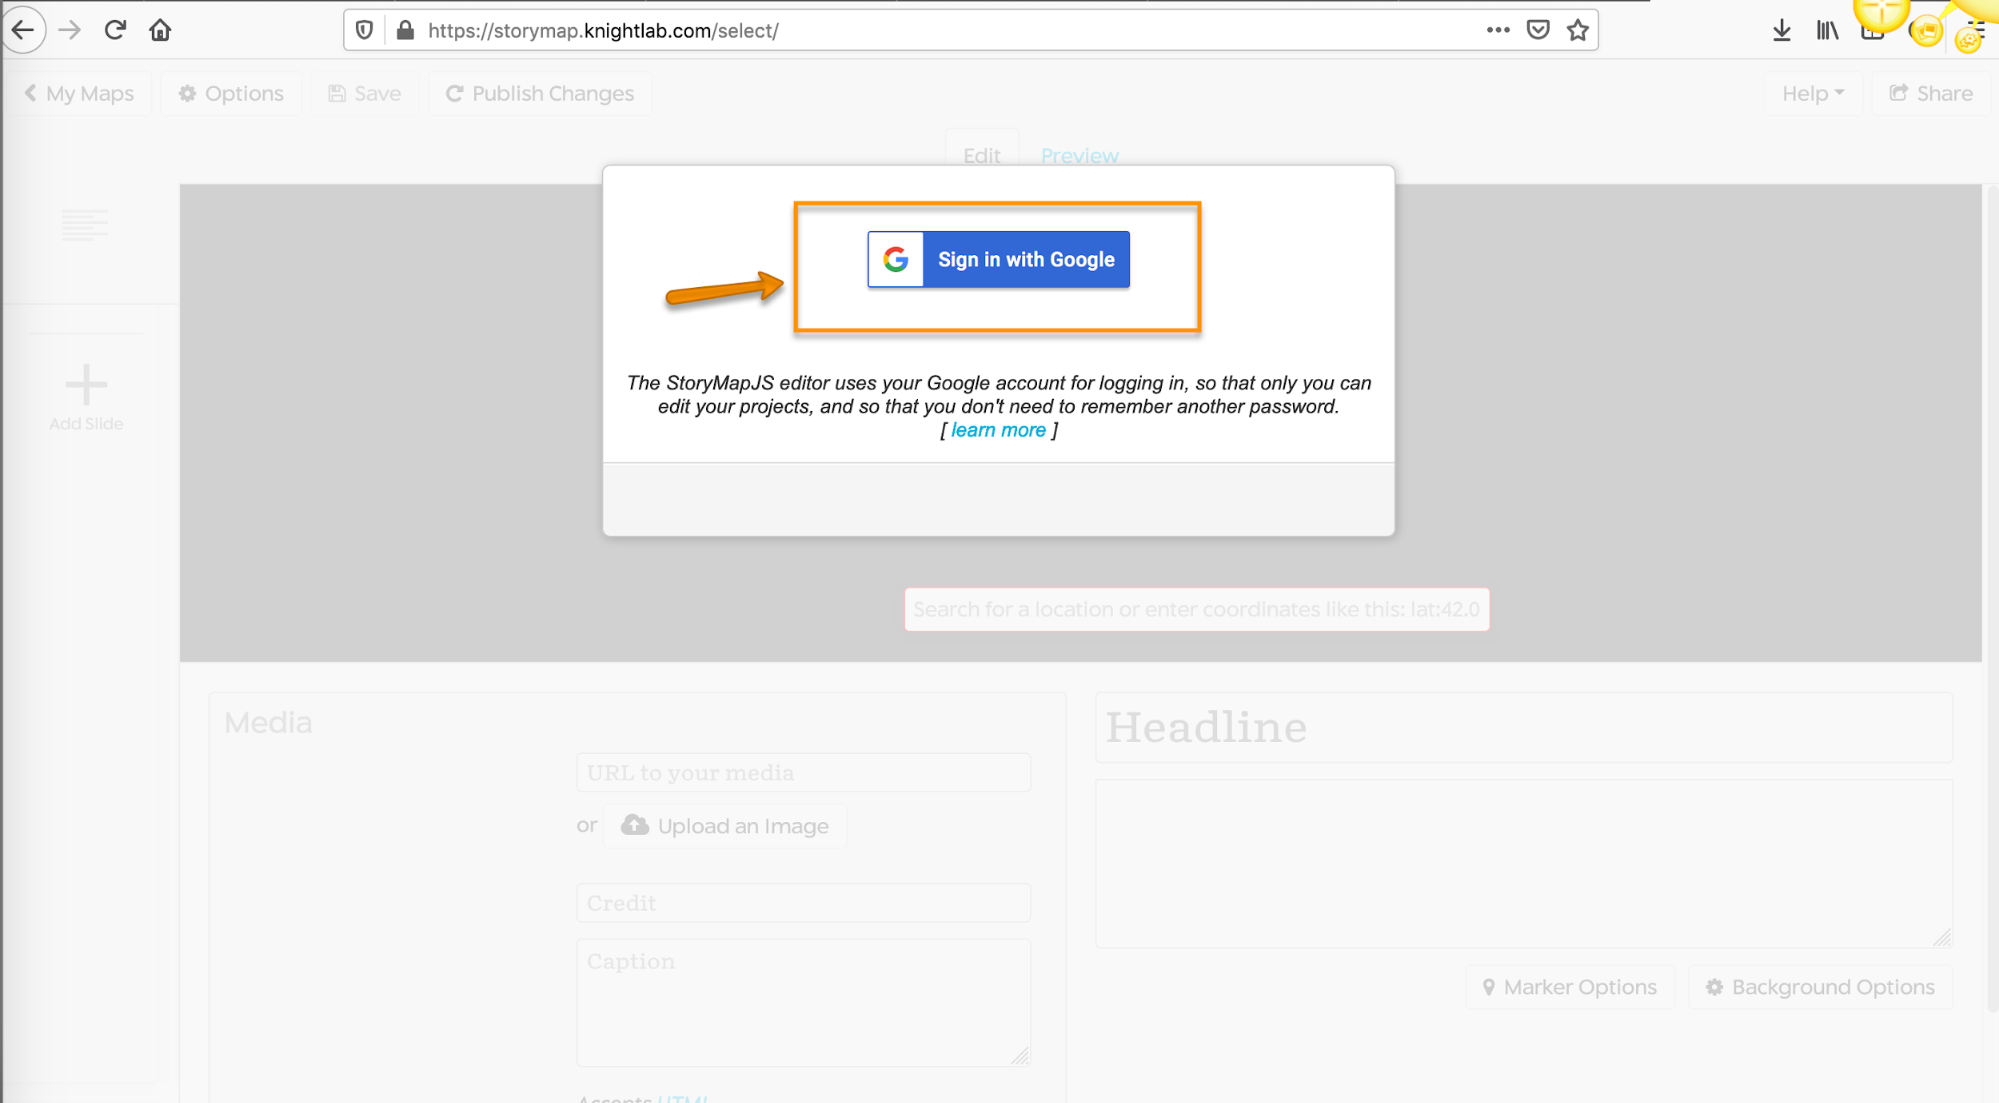
StoryMap JS: Sign in with Google.
Type in a title for your story map and click “Create.”
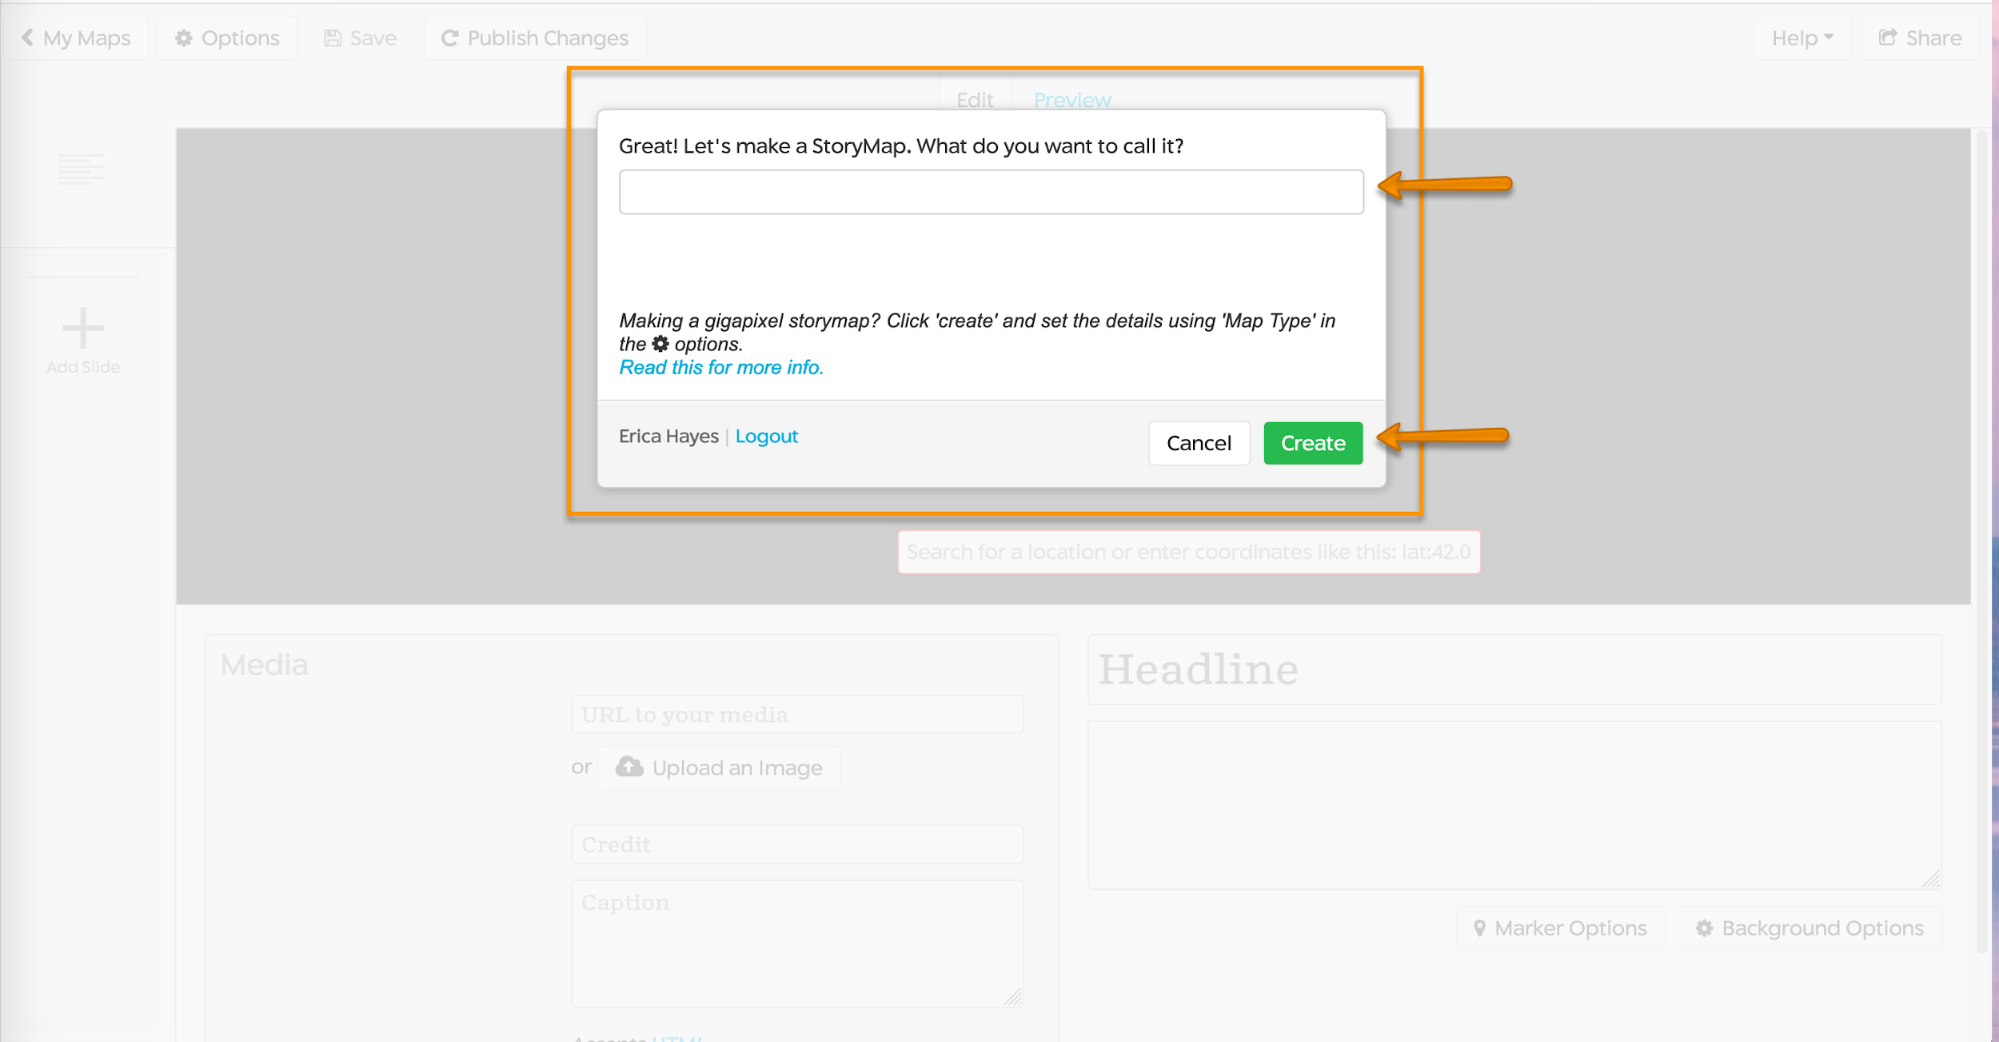
Add a title for your StoryMap and click Create.
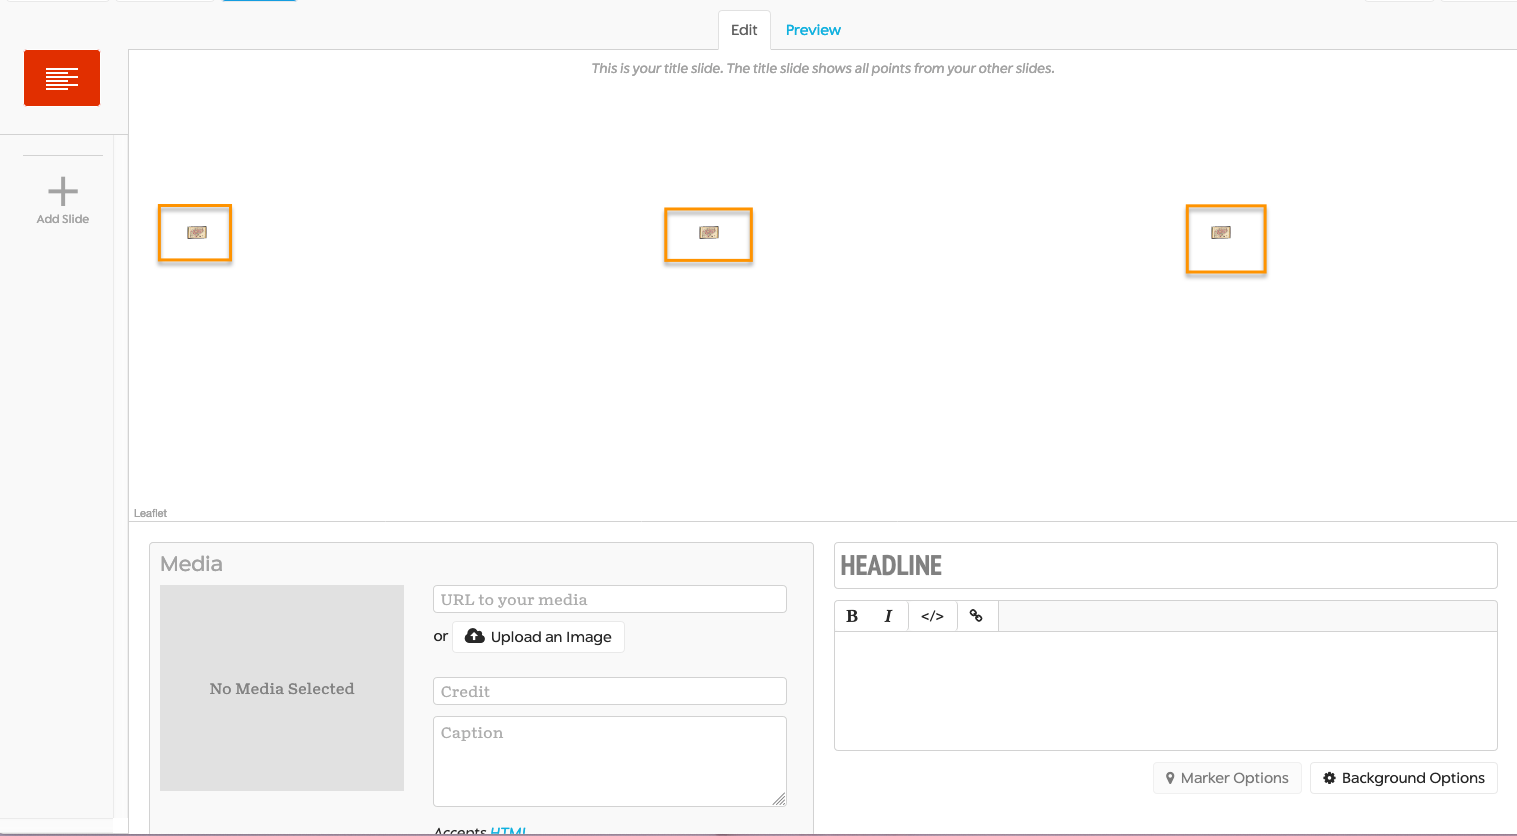
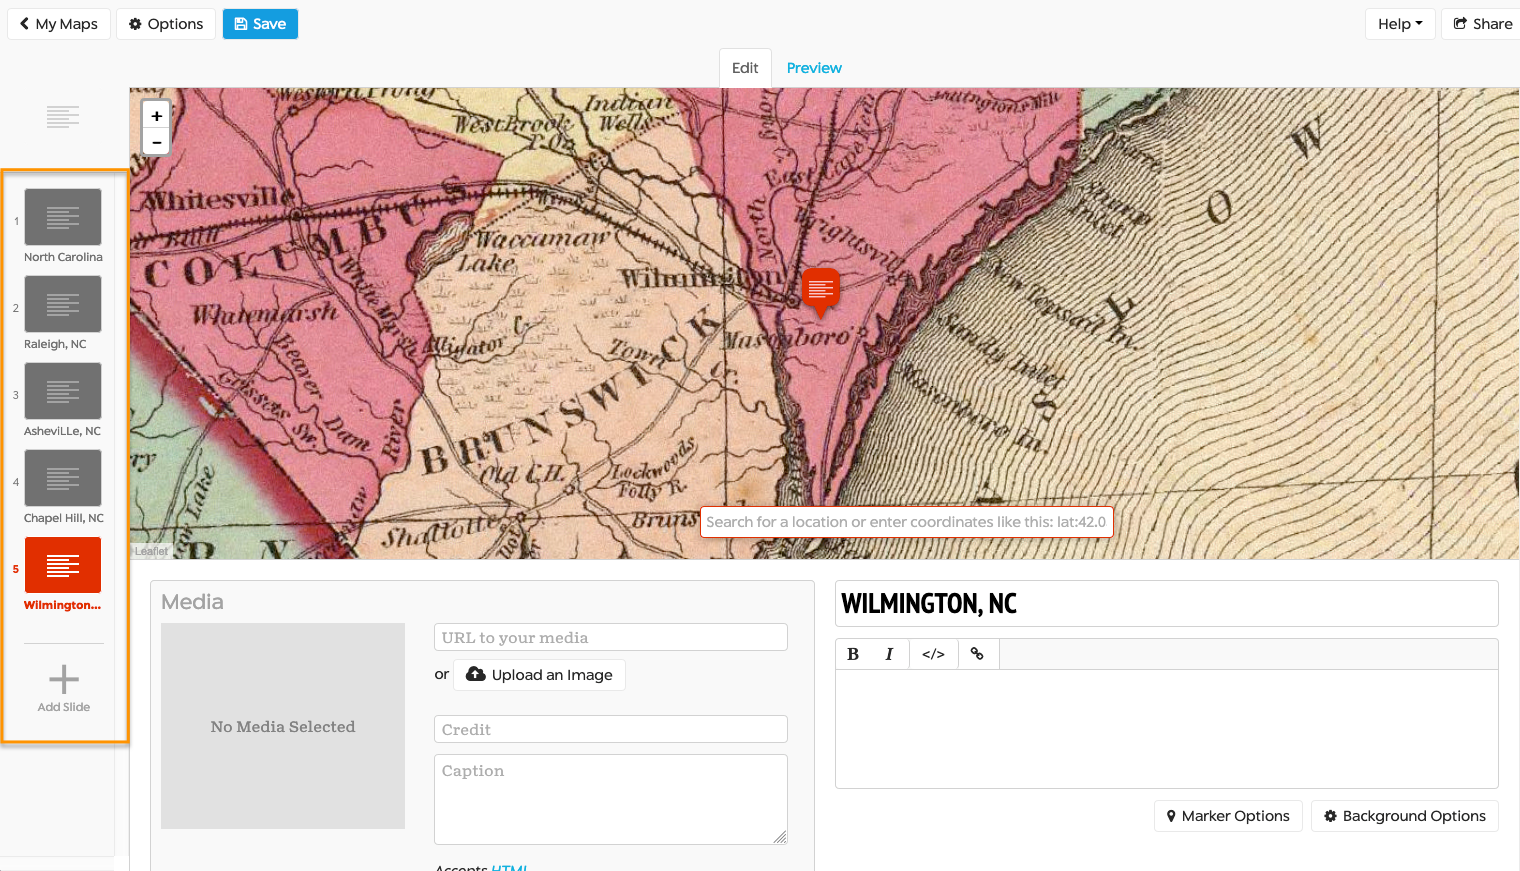
After logging-in and clicking create, you will see the StoryMap JS authoring tool ready for you to add content to the title slide. Here is a brief overview of the sections of StoryMap JS’s interface:
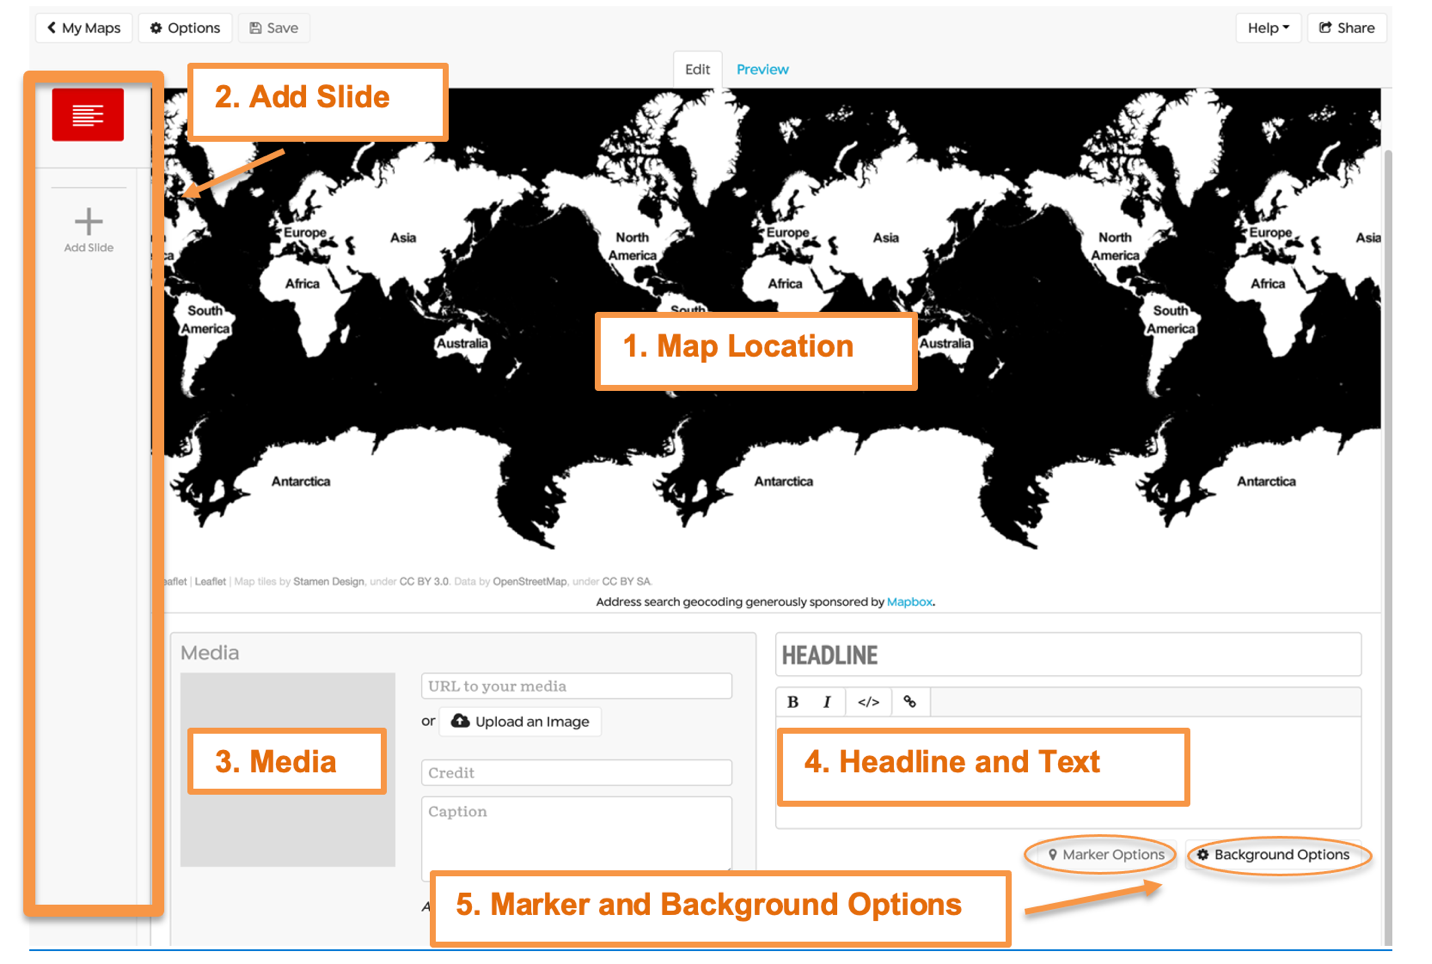
Overview of StoryMap JS’s authoring tool interface.
- Map Location: This is where you set the location on your map. Since this is the title slide, no search bar appears to add a location to this particular slide.
- Add Slide: This column displays slide icons. The title slide is shown in red. The plus icon labelled “Add Slide” allows you to add more slides (locations) to your Story Map.
- Media: The Media section allows you to upload images or link to images, video streaming services (e.g., YouTube, Vimeo, SoundCloud, etc.) to your slide.
- Headline and Text: Here is where you can add a headline or title for each slide with some descriptive text to write your narrative. The text box has bold, italic, and hyperlink buttons. It also includes an Edit HTML button “</>”, so you can view the text you add with HTML tags.
- Marker and Background Options: Here is where you can add customized markers for each point on your map. Under Background Options, you can add a background color or image for your header and text. Since this is the title page, the Marker Options are grayed out because you haven’t added a location yet. Once you have added another slide and a location, you can then click on the Marker Options to customize the points on your map.
At the top left-hand corner of the StoryMap JS authoring tool interface, you will see an Options button.
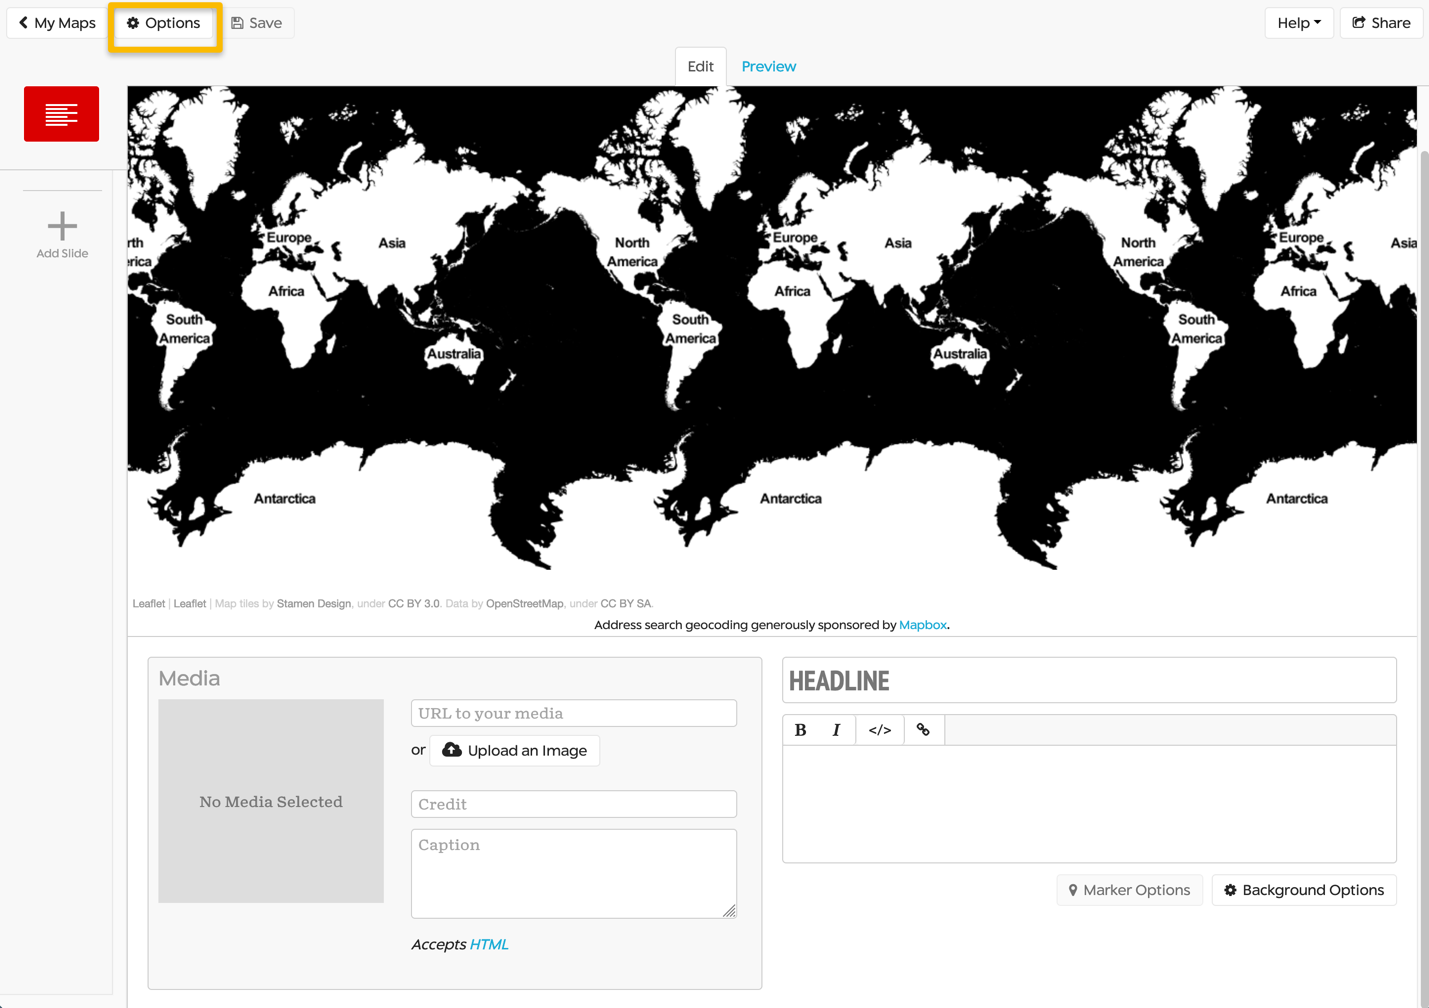
Options dialog box in StoryMap JS.
The Options dialog box contains several settings for displaying and sharing your Story Map. In the next step, we will select the Options dialog box to change the “Map type” or basemap to load in your georeferenced map.
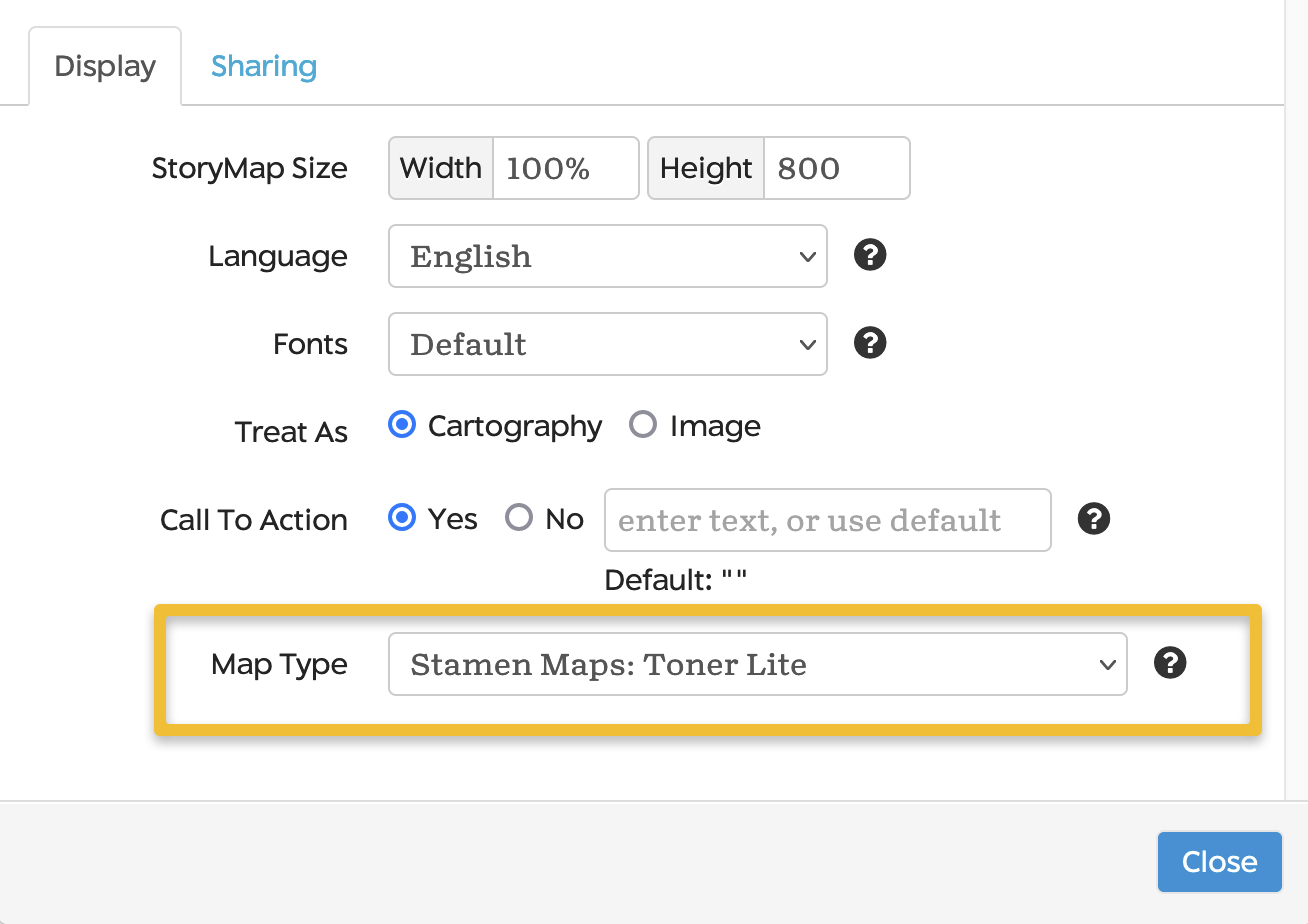
The Options dialog box allows you to change the Map Type or basemap.
Step 3: Adding your georeferenced map to StoryMap JS
Under Map Type in the Options dialog box, you will see several basemap layer options (Stamen Maps: Toner Lite, Stamen Maps: Toner, Stamen Maps: Toner Lines, etc.). To use a georeferenced map in StoryMap JS, you’ll need to add the georeferenced map from Map Warper as your basemap.
In the drop-down menu under Map Type, select “custom” and enter the Tiles URL from Map Warper’s export tab you copied and pasted from Step 1.
It will be formatted as:
https://mapwarper.net/maps/tile/40217/{z}/{x}/{y}.png
This will load in your georeferenced map as the basemap. The sample map we will be using in this tutorial is a 1860 map of North Carolina and South Carolina from The David Rumsey Map Collection.1
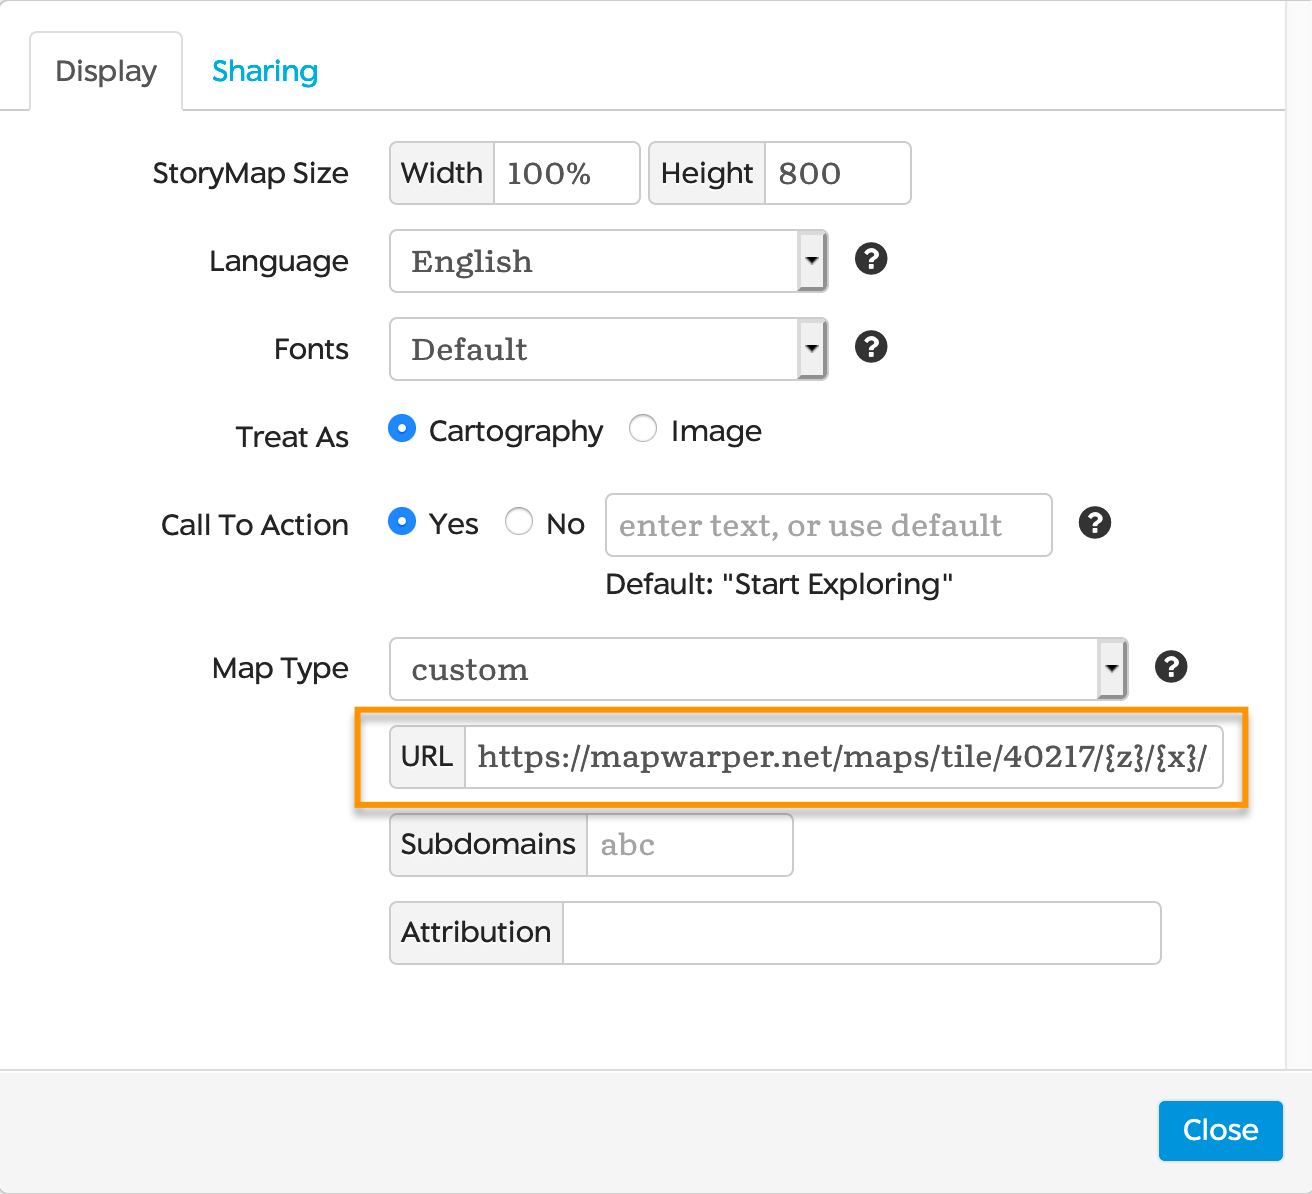
Select the custom map type and enter the Tiles URL from Map Warper to load in your georeferenced map.
Upon loading the georeferenced map into StoryMap JS, you will notice that the georeferenced map repeats and is tiny–what you’re seeing is the “tiled” effect of importing a tileset layer that covers only a small portion of the globe. The next step will fix that!
Imported tile layer of georeferenced map in StoryMap JS.
Step 4: Add additional slides
Click the Add Slide button on the left-hand side of your screen. In the “Search for a location” box, type in a city or state from your georeferenced map. It should zoom into the city or entire state, and the “tile” effect will go away. You can zoom in and out to specify how you want the map to look.
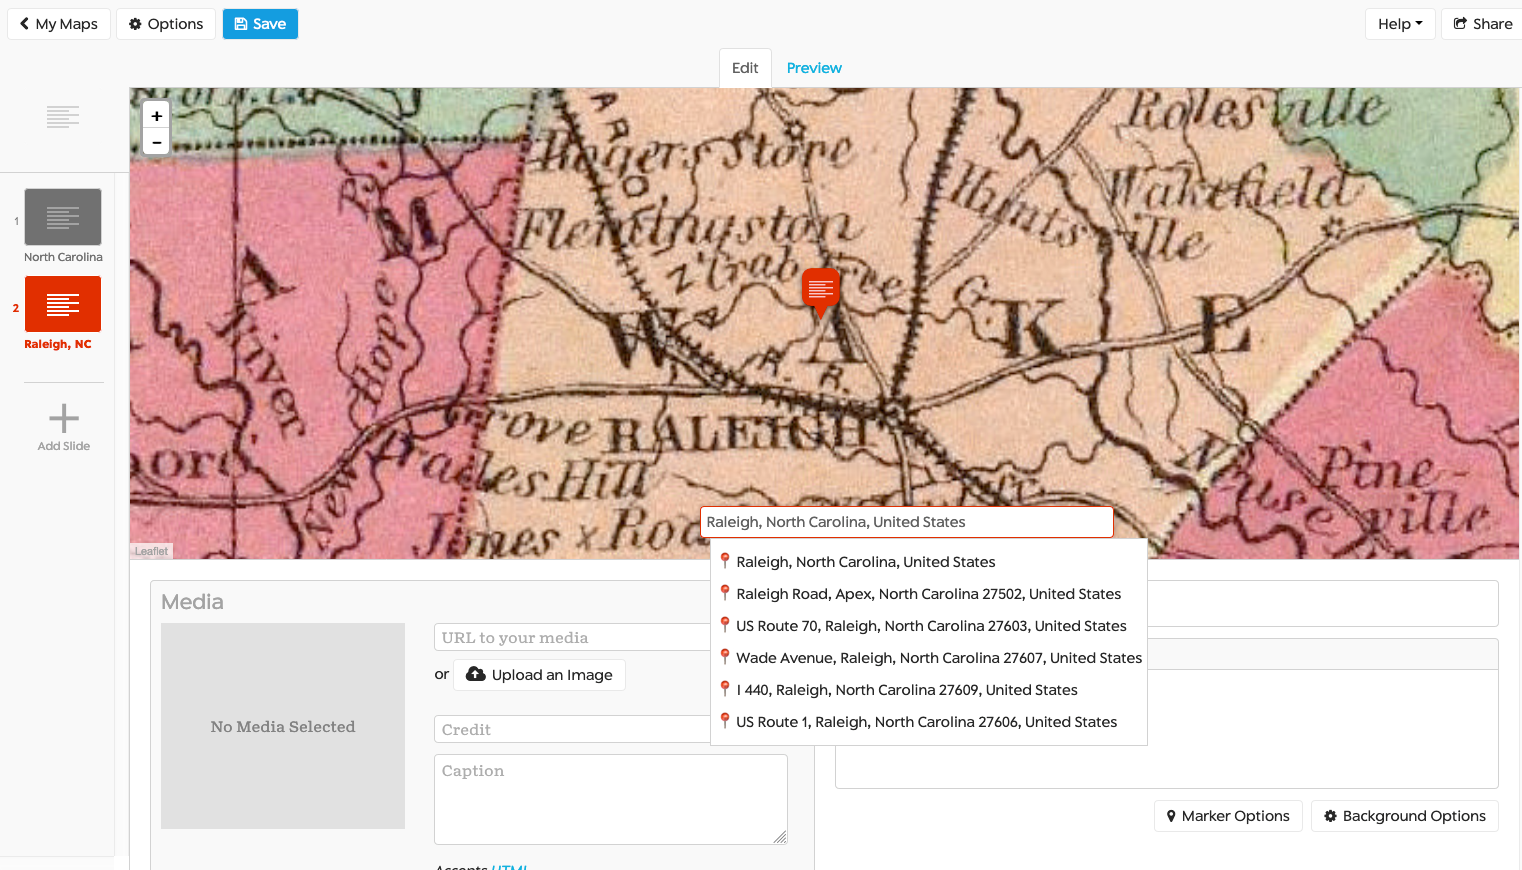
This is an example of a georeferenced map of North Carolina using the StoryMap JS search feature to find the city: Raleigh, NC, United States.
Now add another new slide and enter a new location or geographic coordinates into the location search. You can easily get the geographic coordinates for any location using Google Maps or from a website such as Latitude and Longitude Finder.
In StoryMap JS, you should copy and paste the decimal geographic coordinates of the location you would like to map in the “Search for location” field. Add “lat:” (without quotation marks) in front of the latitude and “lon:” in front of the longitude, like this:
lat:35.595909, lon:-82.550041
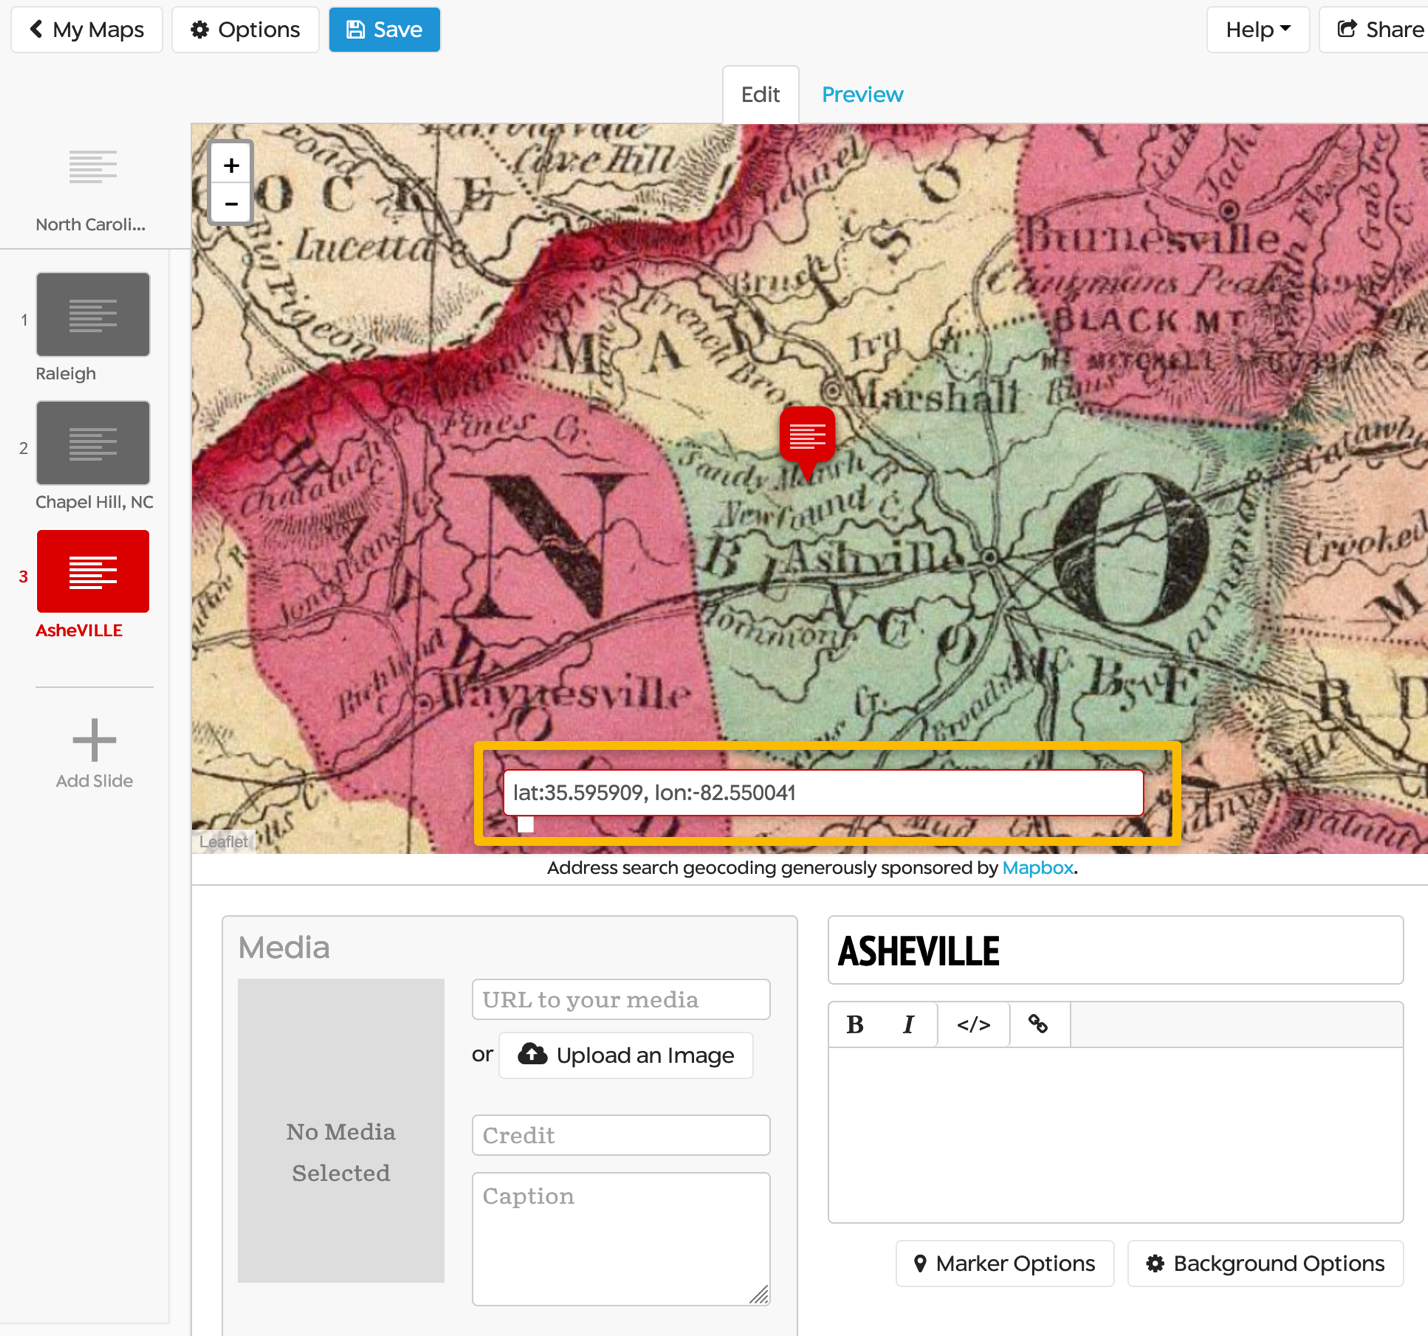
This is an example of a georeferenced map of North Carolina using the StoryMap JS search feature to find the city: Asheville, NC, United States using geographic coordinates.
Step 5: Adding content and media items for each location (slide) in StoryMap JS
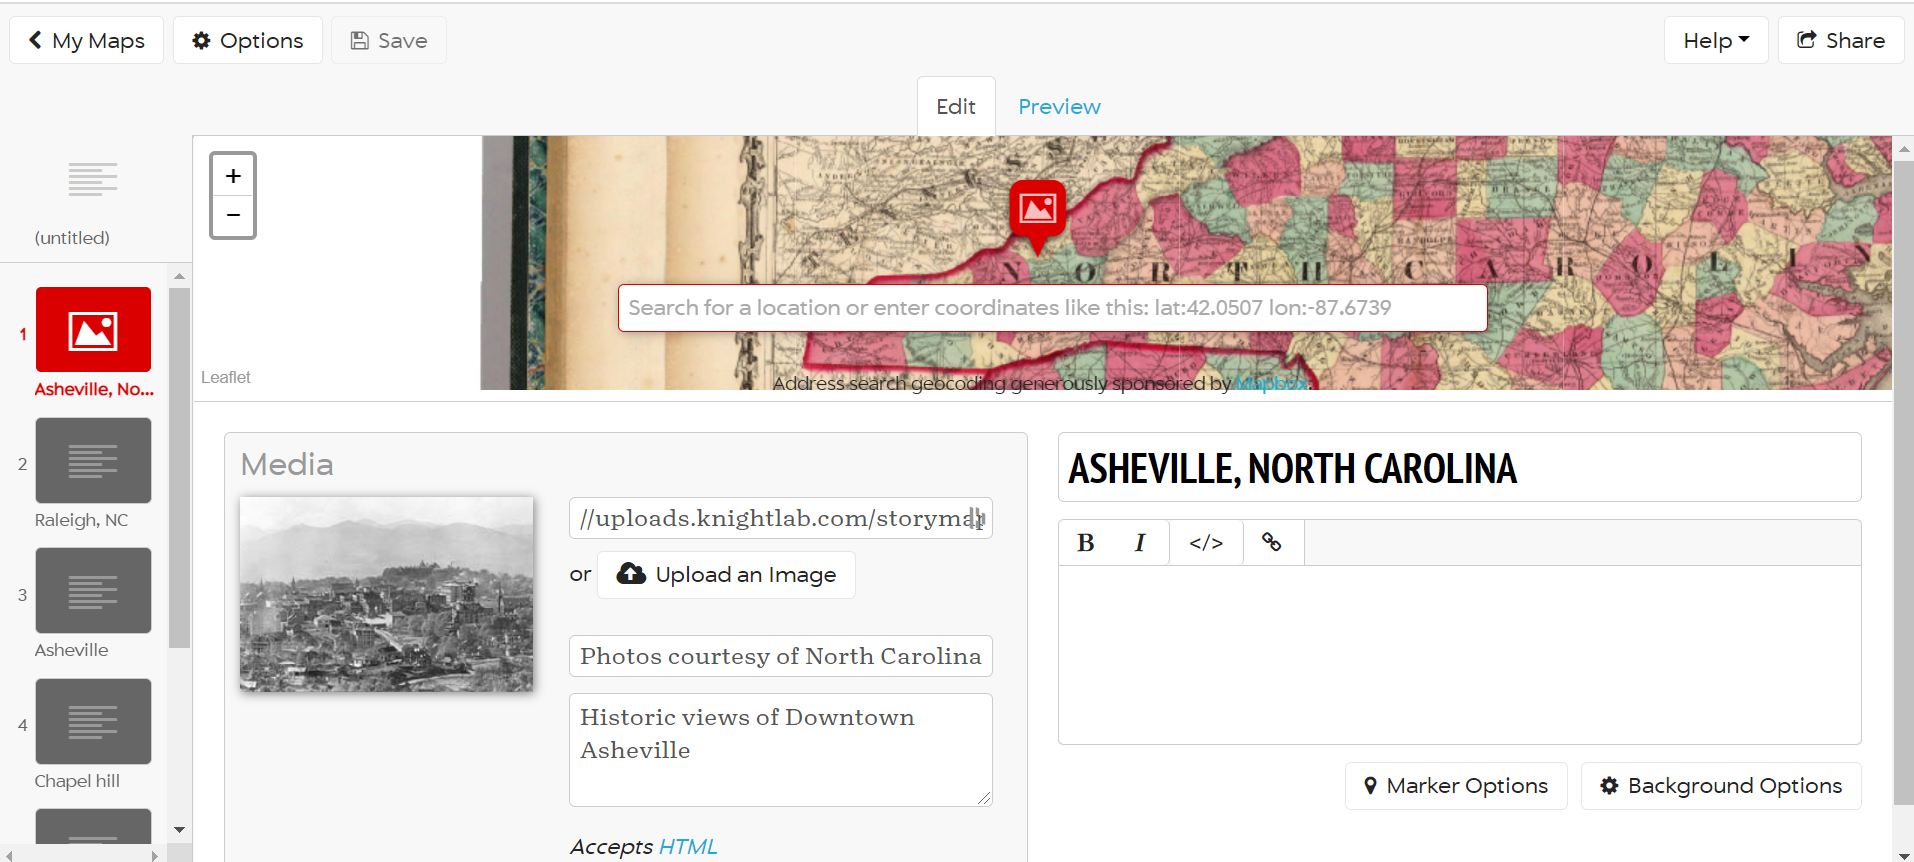
The StoryMap JS builder allows you to upload images, including captions and credit.
The StoryMap JS format puts place and space at the center of your narrative. Each slide in StoryMap JS is connected to a place on the map with a photo or other media (video or audio URL) item you can link to or upload.
In the Media section of your slide, you can add a media item by uploading an image file from your computer, or you can enter a URL to a video (e.g., Youtube video) or audio file (e.g., mp3, wav) online. Additionally, you can credit your media item and provide a caption in the Credit and Caption boxes of each slide. You should use images and media with the appropriate permissions.
Continue to add new slides and locations based on the locations you wish to map, adding headlines, images, credit, and captions as applicable to your geographic story.
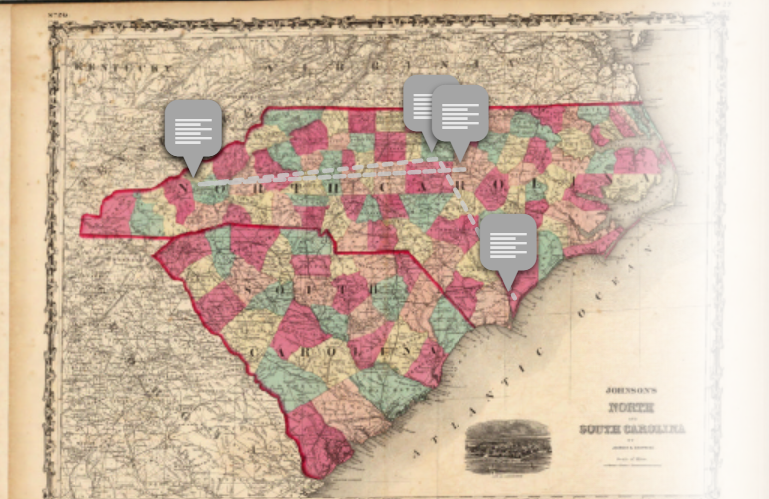
As you add points to the map, you’ll see how accurate your georeferenced map is, by examining how aligned your map is with the cities or geographic points you’re searching for.
Adding new slides and searching for locations will display zoomed-in areas on your map.
The StoryMap JS authoring tool offers customization options (described in Step 6 below) and allows you to toggle between the Edit and Preview views after each change. One thing to note: you must actively save your work using the Save button in the upper left corner.
Step 6: Customize your Story Map
Remove the route lines between markers
Once you have created several slides, in the Preview, you’ll see that each slide is connected via dashed lines. Depending on how you present your narrative, you may not want these lines.
The default setting is to display route lines between each point on the map.
To change this display, click on Options. Then choose Treat As “Image.” This will remove all of the route lines between your points.
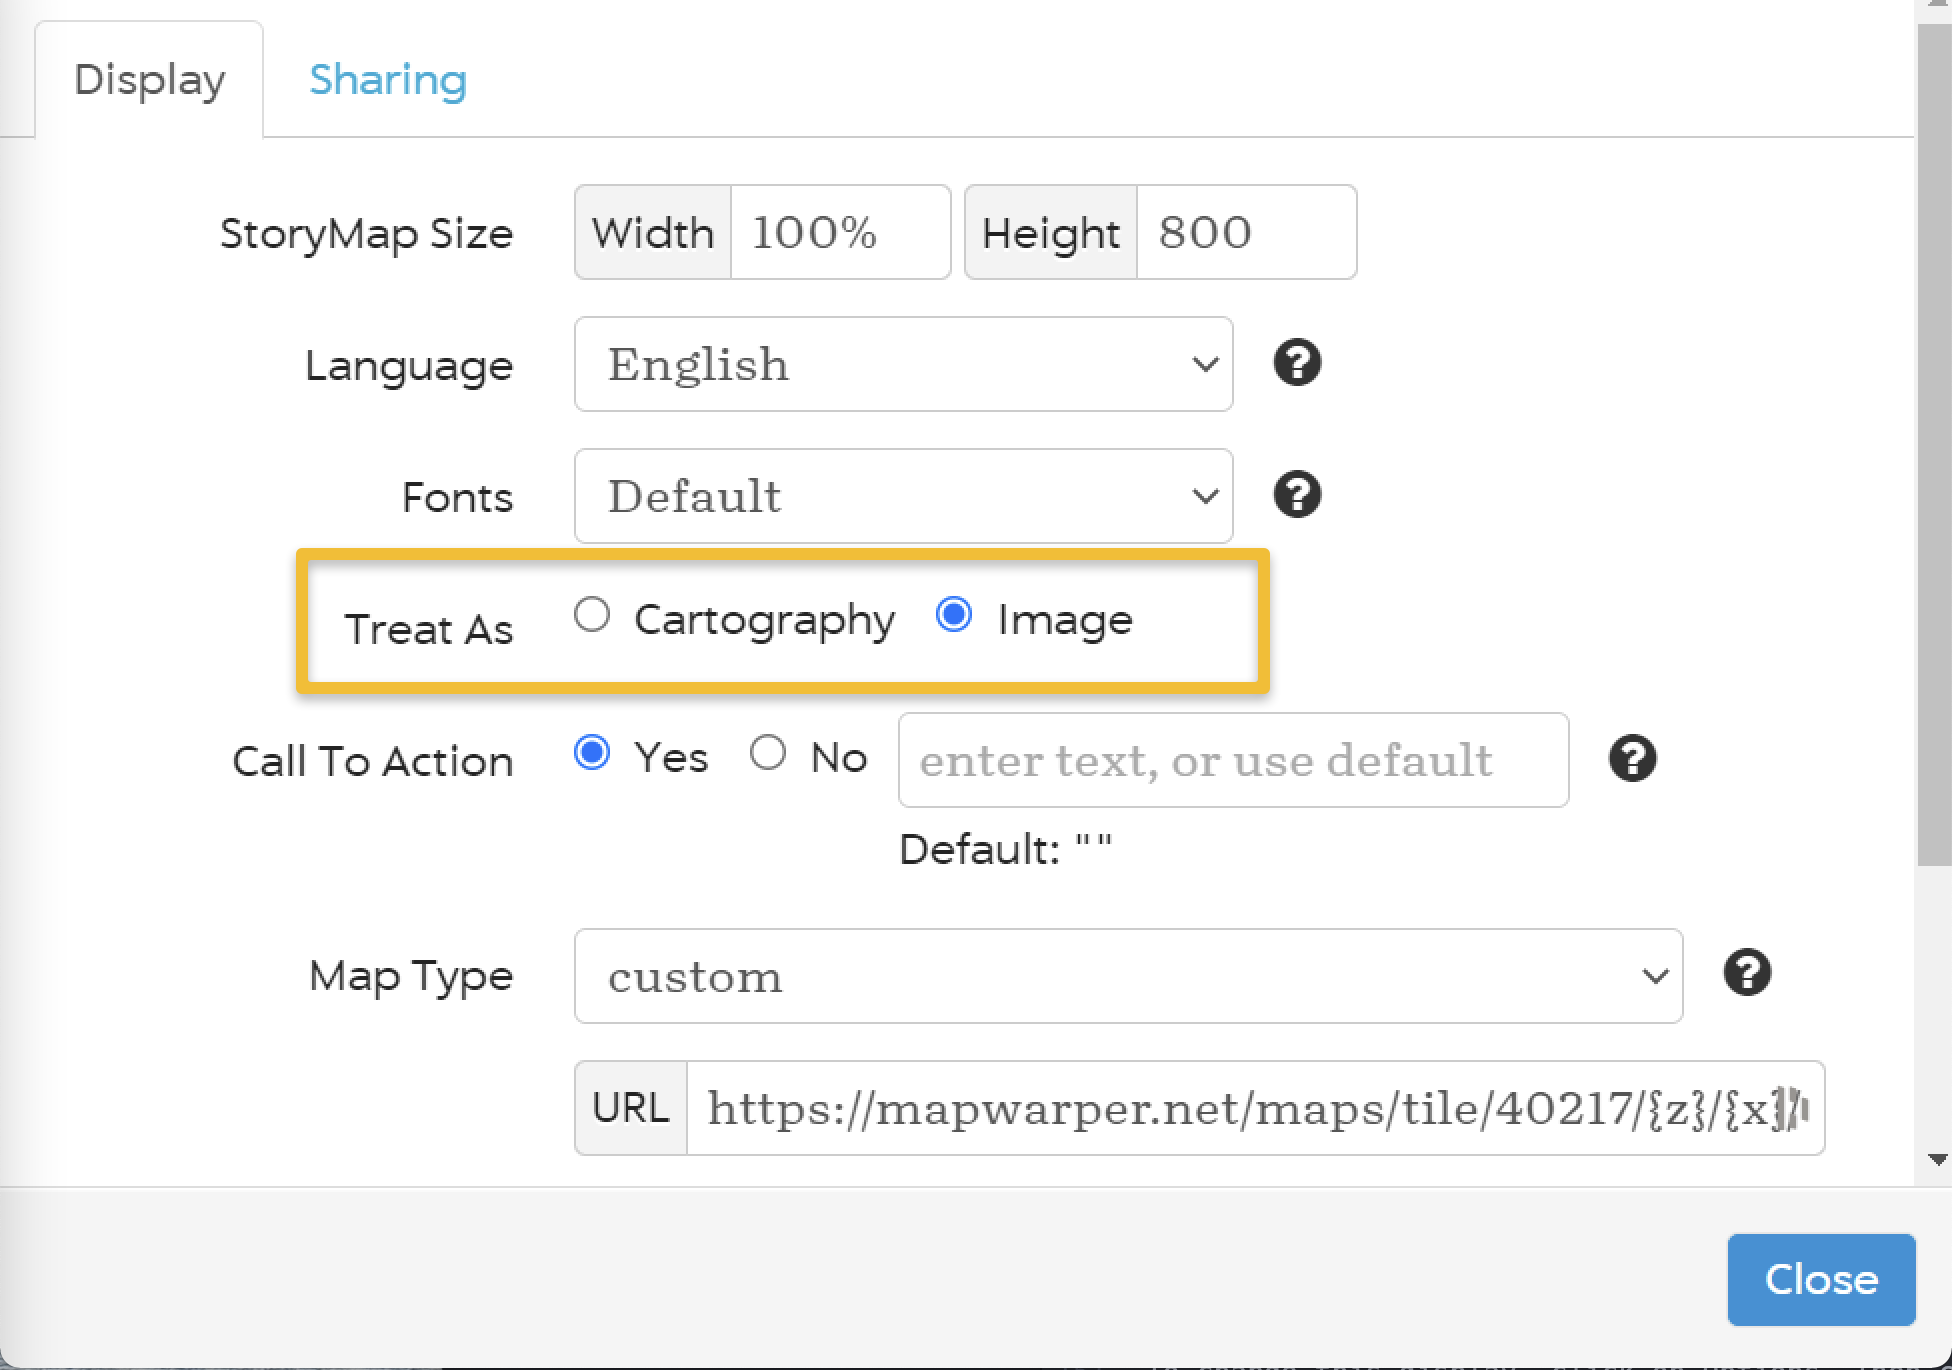
Choose Treat As Image to remove the route lines between points.
Customize your marker icons
You can upload custom icons to your Story Map. You will need to do this individually for each point (slide) of your Story Map, which also gives you the option of creating a distinct marker for one or more of your points.
To do so, click on the Marker Options button at the bottom right corner of the screen and upload a picture of the marker you would like to use. Use a PNG formatted file with a transparent background. To find an appropriate file, you can search for images or icons with the appropriate Creative Commons license using an image search tool.
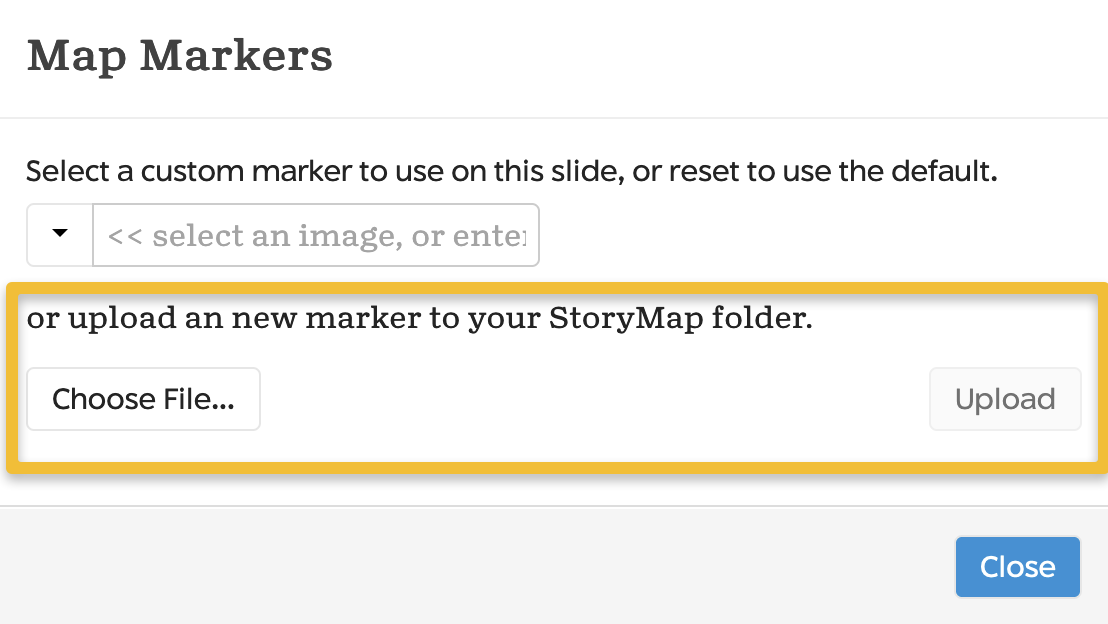
Use the Marker Options button to upload custom markers for your points.
Preview and save your changes
You can preview all changes by switching to the Preview tab of the screen. When you’re happy with your changes, be sure to click the Save button.
Conclusion
You have now completed this lesson. Knowing how to georeference maps means you can bring historic cartography into the present context and allow for new explorations of historic data. We encourage you to think about the classroom applications for displaying georeferenced maps in StoryMap JS, as it is a wonderful exercise for increasing student understanding of geographic and cartographic methods, and the role of space and place in historical thinking. In this lesson we have shown you how to publish and customize your georeferenced map with StoryMap JS. There are several other online publication options for displaying georeferenced maps, including ArcGIS Online, MapBox, or more advanced tools such as Leaflet, for making custom web maps, or QGIS, for publishing maps from QGIS to the web.
Endnotes
-
Johnson, A.J. Johnson’s North and South Carolina by Johnson & Browning. No 26-27. Map. New York: Johnson and Browning. From David Rumsey Center, Historical Map Collection. https://www.davidrumsey.com/luna/servlet/detail/RUMSEY~8~1~2505~310017:North-And-SouthCarolina?sort=Pub_List_No_InitialSort,Pub_Date,Pub_List_No,Series_No&qvq=q:1860%20North%20Carolina;sort:Pub_List_No_InitialSort,Pub_Date,Pub_List_No,Series_No;lc:RUMSEY~8~1&mi=7&trs=18 (accessed June 29, 2020). ↩